Share This Article
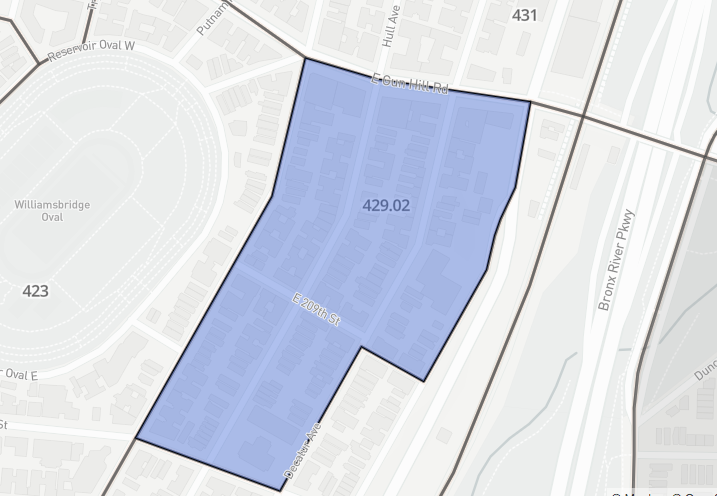
For nearly eight years, I have lived in the southern part of Census Tract 492.02 in the Bronx; I lived three blocks away for eight years before that. But I never would have guessed that this area in the north central section of the borough is more Latino than the Bronx as a whole. Nor did I realize that it has a substantially higher percentage of families living below the federal poverty line than the entire borough. If you had told me than 72 percent of my neighbors who work took public transportation to work, I would not have been surprised—but is is interesting to learn that the comparison rate for the entire Bronx is a significantly lower 60 percent.
Thanks to a newly released tool from the New York City Department of City Planning called Population FactFinder, you can get to know your neighborhood better — its racial and ethnic background, its economic indicators, what people do for work, how many veterans there are, what kinds of disabilities people have. Some of that data is available at the even smaller Census Block level, and you can also scan it at a larger neighborhood scale. The most up-to-date numbers are from the Census Bureau’s annual American Community Survey, but you can also see many stats from Census 2010.
The tool is timely: As the city gears up for what will likely be a fraught Census 2020, the Population FactFinder reveals just how good a picture of life in the city Census data can provide. One’s gut-level understanding of a neighborhood—and its needs—are often in need of adjustment, if not outright reconsideration, in light of these numbers. The city also is beginning an assessment of how well it adheres to the principles of fair housing; data like this will help sharpen the picture of how and where New York City is segregated.
Check it out here.