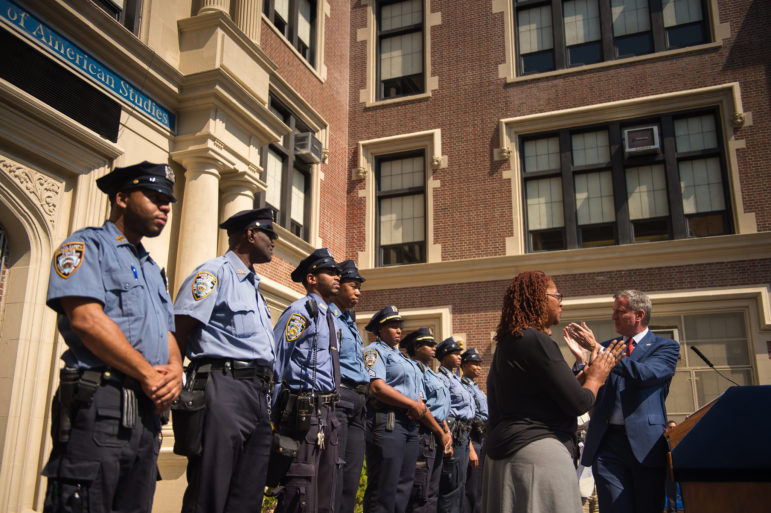
Rob Bennett/Mayoral Photography Office
Mayor de Blasio with school safety agents in 2014.
Assemblywoman Nicole Malliotakis, Republican nominee for mayor, September 27, 2017
As City Hall has touted record-low school crime, opponents (especially those in the charter-school movement) have accused the mayor of ignoring statistics that show an uptick. Malliotakis’ charge actually goes a step further. She doesn’t just say schools are seeing more crime or more violence but that they “not safe.”
Is it safe? Is it safe?
Obviously, the two incidents to which Malliotakis refers above do not on their own prove either that schools are getting more dangerous or that they can be deemed “not safe.” The public school system is huge and statements about the state of or trends in safety cannot be based on individual episodes.
The mayor bases his statements about school safety on statistics about school crimes that are reported to the police. Reports of the seven major felony crimes (murder, rape, assault, robbery, burglary, larceny and auto theft) in schools have dropped each of the past five years, from 699 in fiscal year 2013 (the last full year of the Bloomberg era) to 504 in fiscal 2017, which ended this past June.
Data from the Mayor’s Management Report
| Fiscal Year | Seven major felony crimes in schools |
| FY09 | 902 |
| FY10 | 839 |
| FY11 | 801 |
| FY12 | 812 |
| FY13 | 699 |
| FY14 | 654 |
| FY15 | 614 |
| FY16 | 532 |
| FY17 | 504 |
The Bloomberg administration also relied on police reports for its proclamations about crime in schools.
Of course, some crimes aren’t reported to the police. De Blasio’s opponents say the city should instead use a state system called VADIR (Violent and Disruptive Incident Reporting) that takes reports directly from schools.
If you compare the overall number of incidents reported to VADIR in the 2012-2013 school year with what was reported in the 2015-2016 school year, the most recent for which numbers are available, there is an 11 percent decrease in reports.
Data from VADIR
| 2008-09 | 2009-10 | 2010-11 | 2011-12 | 2012-13 | 2013-14 | 2014-15 | 2015-16 | |
| Enrollment | 997,518 | 991,312 | 1,034,559 | 1,039,737 | 1,041,715 | 1,051,966 | 1,063,853 | 1,069,842 |
| Homicide | 0 | 0 | 0 | 0 | 0 | 1 | 0 | 0 |
| Forcible sex acts | 10 | 13 | 13 | 21 | 17 | 10 | 19 | 20 |
| Other Sex Offenses | 2,113 | 1,875 | 2,015 | 2,436 | 2,105 | 2,151 | 2,239 | 2,317 |
| Robbery with a weapon | 8 | 6 | 3 | 10 | 6 | 3 | 5 | 5 |
| Robbery without a weapon | 149 | 154 | 194 | 229 | 182 | 111 | 116 | 70 |
| Assault With Serious Physical Injury, weapon | 15 | 21 | 37 | 43 | 36 | 39 | 66 | 77 |
| Assault With Serious Physical Injury, no weapon | 237 | 316 | 491 | 471 | 352 | 345 | 504 | 631 |
| Arson | 266 | 270 | 233 | 312 | 320 | 214 | 238 | 208 |
| Kidnapping | 0 | 0 | 0 | 0 | 0 | 0 | 0 | 1 |
| Assault With Physical Injury, weapon | 393 | 309 | 491 | 488 | 560 | 660 | 875 | 954 |
| Assault With Physical Injury, no weapon | 3,643 | 2,849 | 3,785 | 4,434 | 3,946 | 4,021 | 5,696 | 6,687 |
| Reckless Endangerment, weapon | 289 | 329 | 152 | 166 | 138 | 124 | 247 | 98 |
| Reckless Endangerment, no weapon | 1,228 | 1,184 | 710 | 1,020 | 904 | 951 | 1,133 | 1,547 |
| Minor Altercations, weapon | 601 | 795 | 1,292 | 1,268 | 1,097 | 1,079 | 1,375 | 978 |
| Minor Altercations, no weapon | 21,648 | 21,158 | 22,052 | 21,443 | 18,497 | 20,087 | 17,031 | 15,642 |
| Intimidation, Harassment, Menacing, or Bullying (weapon) | 662 | 676 | 688 | 864 | 823 | 862 | 835 | 576 |
| Intimidation, Harassment, Menacing, or Bullying (no weapon) | 5,907 | 6,132 | 6,924 | 7,100 | 6,086 | 5,986 | 4,374 | 4,877 |
| Burglary | 2 | 1 | 6 | 4 | 7 | 6 | 2 | 2 |
| Criminal Mischief with a weapon | 57 | 62 | 23 | 45 | 38 | 36 | 56 | 24 |
| Criminal Mischief without a weapon | 1,889 | 1,609 | 1,628 | 1,557 | 1,249 | 1,227 | 1,178 | 463 |
| Larceny | 1,467 | 1,366 | 1,410 | 1,495 | 1,324 | 1,218 | 1,145 | 826 |
| Bomb Threat | 93 | 76 | 95 | 27 | 111 | 98 | 112 | 148 |
| False Alarm | 337 | 242 | 345 | 307 | 377 | 425 | 373 | 439 |
| Riot | 3 | 2 | 1 | 1 | 1 | 11 | 2 | 4 |
| Weapon Possession | 3,247 | 3,285 | 2,775 | 2,735 | 2,416 | 2,371 | 2,530 | 2,656 |
| Drug possession | 728 | 917 | 1,065 | 1,230 | 1,219 | 1,207 | 1,333 | 1,422 |
| Alcohol possession | 441 | 536 | 670 | 583 | 334 | 361 | 317 | 333 |
| Other disuptive | 18,962 | 17,380 | 21,215 | 21,743 | 13,194 | 17,101 | 15,647 | 8,184 |
| Total incidents | 64,395 | 61,563 | 68,313 | 70,032 | 55,339 | 60,705 | 57,448 | 49,189 |
It’s worth noting that in some of the categories that showed significant changes over time, the number of incidents is relatively small. That means a few incidents here or there generate big percentage changes.
It also means that, thankfully, a very small number of students are victims in those categories. As horrible as it is that any student might suffer a “forcible sex act,” the fact that there were 20 reports of such acts in a system of more than a million students suggests the risks are relatively low.
Feelings matter
Whether it’s regarding schools or the city in general, talking about safety often means discussing perceptions of safety as much as the actual probability of coming to harm. Perceptions can be irrational and self-reinforcing, for sure, but they aren’t uniformly inaccurate, and on some level perceptions are always relevant because they can affect daily life.
The Department of Education surveys parents, students and teachers each year on a range of topics, including safety. Overall, in the 2017 survey done last spring, 91 percent of students said they felt safe in classrooms and 84 percent said they felt safe in hallways and other parts of school. Both measures were on par with what was reported the previous two years.
However, 5 percent of parent respondents did identify school safety as their top concern. That ranked eighth in terms of issues identified as parents, well behind the desires for more enrichment and smaller class size. But it indicates that while safety is not broadly a concern within the DOE community, it is for some families.
A look at survey results for individual schools suggests a similar story. Students were asked about safety across four areas of the school experience. An average of 80 percent or more of respondents said they agreed or strongly agreed that those areas were safe at 836 of the 1100 schools for which responses were reported. When it comes to teachers, 1153 of the 1876 schools listed had more than 80 percent of respondents agreeing that “discipline and order” are maintained at the school. Only at around 10 percent of school did fewer than half of teachers say that was the case.
Signs of trouble
Those same teacher-survey numbers do lead to some questions about the Bronx school, Urban Assembly for Wildlife Conservation, where this week’s tragedy occurred. Sixty-seven percent of teachers there strongly disagreed with the notion that order and discipline were maintained there. Only 19 percent agreed with the statement. Of the roughly 1900 schools surveyed, only three showed higher levels of teacher concern about discipline.
Asked about whether the DOE had seen those numbers and taken any action based on them before this week’s killing, the school department’s press office provided this statement from Schools Chancellor Carmen Fariña: “I have instructed my team to conduct a thorough investigation on all issues, and this is underway. We have additional safety measures and grief counselors in place and will continue to support the school community.”
Taken together, the available evidence offers a mixed picture of whether violence is rising or falling in schools, although the most reliable figures indicate it is decreasing. It does not indicate that there is a system-wide problem of violence. It does suggest, however, that there safety is a worry at a minority of schools.
Beyond the facts is the question of policy response. Some commentators have called for metal detectors and tougher disciplinary policies in the wake of the stabbing, but last night one Bronx organization, the New Settlement Parent Action Committee, made a different call:
While many are calling for increased police presence and metal detectors in the school in response to this tragedy, the New Settlement Parent Action Committee maintains that these measures are merely temporary and superficial solutions to a deep and complex problem. … We must invest in social workers and counselors, not police and metal detectors. … Metal detectors will not prevent violent fights in our schools; we know that anything can be made into a weapon if a student is feeling trapped and desperate, but if our schools are safe, affirming, and supportive environments for young people, we can eliminate violence in our schools altogether.
While the use of suspensions has fallen during the de Blasio years, some of his critics contend more reform is needed because stark racial disparities persist.


