Mayoral Photography Office
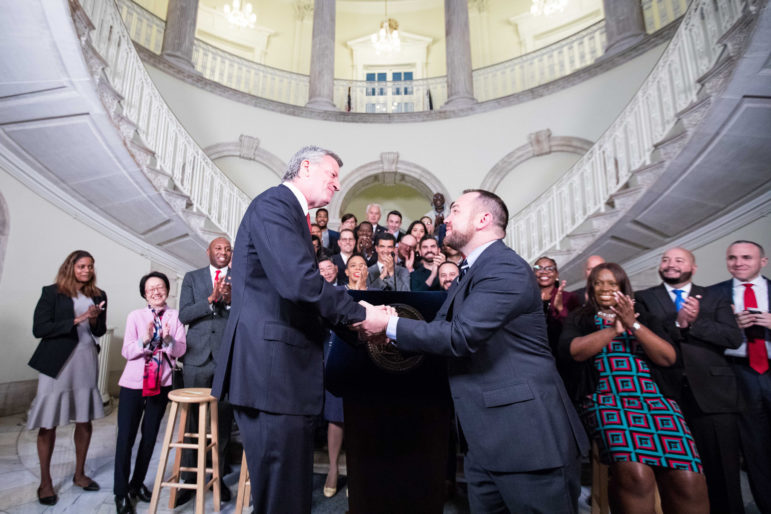
Mayor de Blasio and Council Speaker Corey Johnson shake on their budget deal for fiscal 2019.
And so, on June 30, we’ll come to the end of another New York City fiscal cycle. Another year over, a new one just begun.
Amid the New (Fiscal) Year revelry sure to ensue on Saturday night, the turning of the fiscal page is a chance to look slightly deeper at the city budget that was adopted earlier this month.
Its $89.2 billion price-tag—nearly $4 billion more than the previous year’s adopted budget—is the headline number. But the growth is not apportioned evenly across agencies.
Some are slated to see major resource increases, while others are supposed to grow more modestly, and a few are budgeted for less money than in fiscal 2018.
The budget is merely a plan; reality often turns out different, as it did in the fiscal year that is ending, when the modified budget—the one that is adjusted for what agencies actually spend—was $4.8 billion more than the adopted budget.
And the numbers that follow for city departments and elected officials (we left boards, commissions and smaller offices out) are merely those reported in the city’s annual budget summary, so they don’t tell the full story on what short-term blips might be skewing the figures.
But they do provide some indication of how the city’s priorities, or at least the way it spends money on them, are evolving. Here they are, ranked from the agency seeing the biggest growth on down, with dollars in millions:
| Entity | FY2018 adopted budget | FY2019 adopted budget | Change |
| Small Business Services | $217 | $285 | 31.56% |
| Homeless Services | $1,617 | $2,062 | 27.49% |
| City Council | $64 | $81 | 26.98% |
| Records and Information Services | $8 | $10 | 22.47% |
| Community Boards | $18 | $20 | 15.82% |
| Probation | $103 | $120 | 15.81% |
| Veterans’ Services | $4 | $5 | 15.73% |
| Law | $210 | $235 | 12.19% |
| Buildings | $185 | $205 | 10.85% |
| Transportation | $968 | $1,043 | 7.71% |
| Youth and Community Development | $813 | $872 | 7.28% |
| Information Technology and Telecommunication | $628 | $667 | 6.12% |
| Cultural Affairs | $189 | $200 | 6.01% |
| Aging | $366 | $386 | 5.45% |
| District Attorneys | $375 | $396 | 5.40% |
| Education | $24,329 | $25,593 | 5.20% |
| Planning | $50 | $52 | 5.09% |
| Health and Mental Hygiene | $1,612 | $1,679 | 4.13% |
| Sanitation | $1,679 | $1,743 | 3.79% |
| Consumer Affairs | $42 | $43 | 2.88% |
| Mayoralty | $137 | $140 | 2.16% |
| Comptroller | $106 | $108 | 2.00% |
| Social Services | $9,900 | $10,068 | 1.70% |
| Citywide Administrative Services | $1,189 | $1,198 | 0.77% |
| Police | $5,572 | $5,595 | 0.42% |
| Parks | $532 | $534 | 0.42% |
| Finance | $303 | $304 | 0.32% |
| Public Advocate | $4 | $4 | -0.01% |
| Housing Preservation and Development | $1,145 | $1,142 | -0.23% |
| Borough Presidents | $28 | $28 | -0.30% |
| Fire | $2,041 | $2,030 | -0.51% |
| Environmental Protection | $1,413 | $1,388 | -1.76% |
| Correction | $1,444 | $1,404 | -2.82% |
| Emergency Management | $59 | $57 | -4.33% |
| Children’s Services | $3,129 | $2,972 | -5.04% |
| Investigations | $44 | $39 | -11.28% |
| Design & Construction | $352 | $162 | -53.87% |