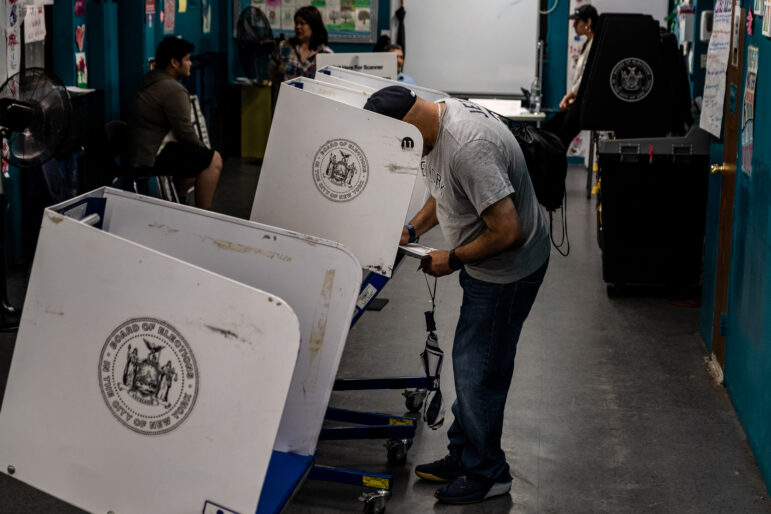
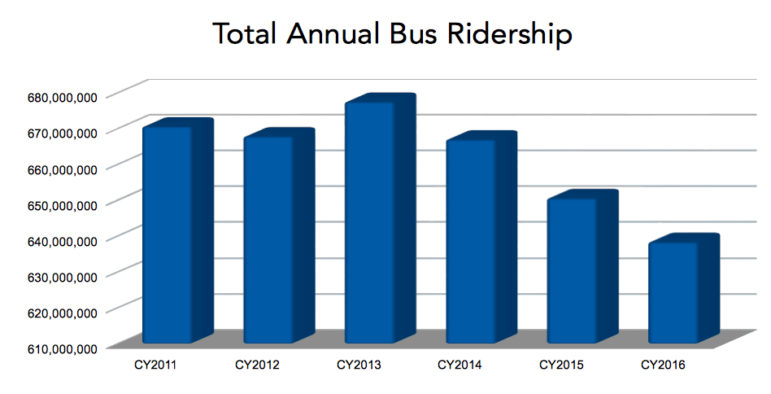
In an ongoing series of stories about the city’s often undervalued bus system, City Limits has highlighted an important tension: The system is critically important, especially to neighborhoods outside the city’s core that are poorly served by the subway, and particularly to mobility-impaired New Yorkers who depend on buses because they cannot feasibly access the trains. But likely because of service problems, bus ridership overall has been shrinking.
Click for more transit coverage and rider resources!
That’s more true for some lines than others, and on some bus routes, ridership is increasing. Improvements in service on some lines—like the launch of select bus service—can boost ridership, and development can bring larger crowds to the bus stops.
Below are some of the MTA’s ridership statistics for the majority of lines in the city, and links to schedules for each route (though the MTA does not provide data for each right). Click on the borough below to see the list of buses that run there.
Brooklyn
Bronx
Manhattan
Queens
Staten Island
Express Buses
Brooklyn Local Buses: Average Weekday Ridership
| Route | Service Area | 2015 | 2016 | 2015-2016 Change % | 2016 Rank |
| B1 | Ocean Parkway/86 Street | 19,409 | 19,828 | 2.20% | 25 |
| B2 | Avenue R | 2,579 | 2,464 | -4.50% | 158 |
| B3 | Avenue U | 11,914 | 11,803 | -0.90% | 58 |
| B4 | Bay Ridge Parkway/86 Street | 5,653 | 6,195 | 9.60% | 118 |
| B6 | Bay Parkway/Avenue J/Flatlands Av | 41,175 | 41,320 | 0.40% | 4 |
| B7 | Kings Highway/Saratoga Avenue | 5,870 | 6,066 | 3.30% | 121 |
| B8 | 18 Avenue/Avenue D | 19,541 | 19,616 | 0.40% | 26 |
| B9 | 60 Street/Avenue M | 12,785 | 14,404 | 12.70% | 42 |
| B11 | 49 & 50 Streets/Avenue J | 11,283 | 11,273 | -0.10% | 64 |
| B12 | Clarkson Av/Empire Blvd/East New York Av | 15,766 | 15,380 | -2.40% | 35 |
| B13 | Crescent St/Jamaica Avenue/Wyckoff Av | 5,844 | 6,290 | 7.60% | 117 |
| B14 | Sutter/Pitkin Avenues | 7,214 | 7,243 | 0.40% | 109 |
| B15 | Marcus Garvey Boulevard/New Lots Avenue | 22,153 | 22,282 | 0.60% | 23 |
| B16 | Ft Hamilton Parkway/13 & 14 Avenues | 6,686 | 6,739 | 0.80% | 115 |
| B17 | Remsen/Seaview Avenues | 11,605 | 11,279 | -2.80% | 63 |
| B20 | Pennsylvania Avenue/Linden Boulevard | 7,433 | 7,042 | -5.30% | 111 |
| B24 | Greenpoint/Kingsland Avenues | 2,379 | 2,390 | 0.50% | 160 |
| B25 | Fulton Street | 10,041 | 10,048 | 0.10% | 80 |
| B26 | Halsey/Fulton Streets | 9,757 | 9,723 | -0.30% | 87 |
| B31 | Gerritsen Avenue | 2,664 | 2,753 | 3.30% | 154 |
| B32 | Bway/Kent Av/Franklin St/McGuiness Blvd | 725 | 819 | 13.00% | 173 |
| B35 | Church Avenue/39 Street | 33,016 | 31,886 | -3.40% | 7 |
| B36 | Avenue Z/Surf Avenue | 14,320 | 14,026 | -2.10% | 46 |
| B37 | Fort Hamilton/Boerum Hill via Third Ave | 2,208 | 2,380 | 7.80% | 161 |
| B38 | DeKalb/Lafayette Avenues | 19,241 | 19,099 | -0.70% | 27 |
| B39 | Williamsburg Bridge Plaza, Brooklyn/Lower East Side, Manhattan | 258 | 260 | 0.80% | 182 |
| B41 | Flatbush Avenue | 28,690 | 27,082 | -5.60% | 16 |
| B42 | Rockaway Parkway | 4,310 | 4,186 | -2.90% | 143 |
| B43 | Manhattan Av/Graham Av/Tompkins Av | 10,530 | 10,540 | 0.10% | 72 |
| B44Lcl/SBS | Nostrand Avenue/Sheepshead Bay/Williamsburg Bridge Plaza | 37,021 | 37,418 | 1.10% | 5 |
| B45 | St Johns Place | 6,217 | 6,019 | -3.20% | 123 |
| B46Lcl/SBS | Kings Plaza-Via Utica Ave/Malcolm X Blvd-Williamsburg Bridge Plaza | 44,431 | 43,463 | -2.20% | 3 |
| B47 | Broadway/Ralph Avenue/Avenue U | 10,611 | 10,436 | -1.60% | 74 |
| B48 | Lorimer Street/Franklin & Classon Avenues | 3,759 | 3,851 | 2.40% | 146 |
| B49 | Ocean Avenue/Bedford & Rogers Avenues | 12,755 | 12,452 | -2.40% | 51 |
| B52 | Gates Avenue | 12,451 | 12,435 | -0.10% | 52 |
| B54 | Myrtle Avenue | 10,946 | 10,466 | -4.40% | 73 |
| B57 | Flushing Avenue | 7,072 | 7,244 | 2.40% | 108 |
| B60 | Wilson Avenue/Rockaway Avenue | 9,753 | 9,906 | 1.60% | 84 |
| B61 | Van Brunt Street/Columbia St/Atlantic Avenue | 10,233 | 9,945 | -2.80% | 83 |
| B62 | Long Island City – Downtown Brooklyn | 8,652 | 7,882 | -8.90% | 101 |
| B63 | Fifth/Atlantic Avenues | 11,778 | 11,607 | -1.50% | 60 |
| B64 | 86 Street/Bath Avenue | 5,579 | 5,732 | 2.70% | 127 |
| B65 | Bergen/Dean Streets | 3,437 | 3,398 | -1.10% | 150 |
| B67 | McDonald/7 Avenues | 4,521 | 4,504 | -0.40% | 135 |
| B68 | Coney Island/Brighton Beach Avenues | 14,182 | 14,159 | -0.20% | 45 |
| B69 | 7 & Vanderbilt Avenues | 3,989 | 4,225 | 5.90% | 141 |
| B70 | 7 & 8 Avenues | 5,387 | 5,942 | 10.30% | 124 |
| B74 | Mermaid Avenue | 4,436 | 4,225 | -4.80% | 141 |
| B82 | Bay Pkwy/Kings Hwy/Flatlands Av | 27,930 | 27,959 | 0.10% | 13 |
| B83 | Van Siclen/Pennsylvania Avenues | 8,642 | 8,281 | -4.20% | 97 |
| B84 | Ashford St/Flatlands/Fountain Avenues | 585 | 595 | 1.70% | 178 |
| Other Brooklyn routes | 324 | 452 | 39.50% | ||
| Brooklyn Local | 609,740 | 607,012 | -0.40% |
Bronx Local Buses: Average Weekday Ridership
| Route | Service Area | 2015 | 2016 | 2015-2016 Change % | 2016 Rank |
| Bx1/2 | Grand Concourse | 38,411 | 36,487 | -5.00% | 6 |
| Bx3 | University Avenue/West 181 Street | 15,042 | 14,921 | -0.80% | 38 |
| Bx4 | Westchester Avenue | 11,542 | 11,411 | -1.10% | 61 |
| Bx5 | Bruckner Boulevard Svc Rd/Story Av | 11,786 | 11,194 | -5.00% | 67 |
| Bx6 | East 161/East 163 Streets | 24,642 | 23,800 | -3.40% | 21 |
| Bx7 | Riverdale Avenue/Broadway | 13,570 | 13,720 | 1.10% | 48 |
| Bx8 | Bronxwood Av/Williamsbridge Rd | 7,148 | 7,282 | 1.90% | 107 |
| Bx9 | Broadway/Kingsbridge Road | 27,517 | 27,175 | -1.20% | 15 |
| Bx10 | Riverdale/Norwood | 11,040 | 11,266 | 2.00% | 65 |
| Bx11 | Claremont Parkway/170 Street | 14,818 | 14,269 | -3.70% | 43 |
| Bx12Lcl/SBS | Pelham Parkway/Fordham Rd | 48,656 | 48,124 | -1.10% | 1 |
| Bx13 | Ogden Avenue/West 181 Street | 11,818 | 12,094 | 2.30% | 55 |
| Bx15 | 3 Avenue/125 Street | 30,687 | 28,156 | -8.20% | 12 |
| Bx16 | East 233 Street/Nereid Avenue | 8,031 | 8,239 | 2.60% | 98 |
| Bx17 | Crotona Avenue/Prospect Avenue | 10,559 | 10,219 | -3.20% | 77 |
| Bx18 | Macombs Road | 1,844 | 1,920 | 4.10% | 163 |
| Bx19 | Southern Boulevard/East 149 Street | 31,531 | 29,378 | -6.80% | 11 |
| Bx20 | Broadway/Henry Hudson Parkway Svc Rd | 804 | 772 | -4.00% | 174 |
| Bx21 | Morris Park Avenue/Boston Road | 16,055 | 15,234 | -5.10% | 36 |
| Bx22 | Castle Hill Avenue | 15,102 | 14,690 | -2.70% | 41 |
| Bx24 | Pelham Bay Park – Country Club | 732 | 754 | 3.00% | 176 |
| Bx25/Bx26 | Allerton Avenue | 8,018 | 7,988 | -0.40% | 100 |
| Bx27 | Westchester/Soundview Avenues | 7,743 | 7,435 | -4.00% | 104 |
| Bx28/Bx38 | East Gun Hill Rd – Co-op City – Bay Plaza | 16,066 | 15,750 | -2.00% | 34 |
| Bx29 | City Island | 2,524 | 2,476 | -1.90% | 156 |
| Bx30 | Boston/East Gun Hill Roads | 9,814 | 9,680 | -1.40% | 89 |
| Bx31 | Eastchester Road | 10,349 | 10,019 | -3.20% | 81 |
| Bx32 | Morris/Jerome Avenues | 7,049 | 6,809 | -3.40% | 114 |
| Bx33 | Port Morris, Bronx/Harlem, Manhattan | 2,991 | 2,866 | -4.20% | 151 |
| Bx34 | Bainbridge Avenue | 4,394 | 4,268 | -2.90% | 140 |
| Bx35 | East 167/West 181 Streets | 18,537 | 17,651 | -4.80% | 28 |
| Bx36 | East 174/East 180 Streets | 31,729 | 30,474 | -4.00% | 9 |
| Bx39 | White Plains Rd | 16,670 | 16,434 | -1.40% | 32 |
| Bx40/42 | Tremont Av Crosstown | 26,378 | 25,454 | -3.50% | 17 |
| Bx41Lcl/SBS | Webster/Melrose Avenues | 24,231 | 23,558 | -2.80% | 22 |
| Bx46 | Longwood Ave/Tiffany St/Hunts Point Market | 598 | 619 | 3.50% | 177 |
| Other Bronx routes | 285 | 240 | -15.80% | ||
| Bronx Local routes, total | 538,711 | 522,826 | -2.90% |
Manhattan Local Buses: Average Weekday Ridership
| Route | Service Area | 2015 | 2016 | 2015-2016 Change % | 2016 Rank |
| M1 | Fifth and Madison Avenues | 10,810 | 10,436 | -3.50% | 74 |
| M2 | Fifth and Madison Avs/AC Powell Blvd | 9,614 | 9,275 | -3.50% | 92 |
| M3 | Fifth and Madison Avs/St Nicholas Av | 13,792 | 13,149 | -4.70% | 49 |
| M4 | Fifth and Madison Avs/Broadway (Local and Limited Stops) | 17,080 | 16,235 | -4.90% | 33 |
| M5 | Fifth Av/Av of Americas/Riverside Dr | 10,711 | 10,063 | -6.00% | 79 |
| M7 | Columbus Av/Amsterdam/6/7 Avs/Bway | 13,412 | 12,905 | -3.80% | 50 |
| M8 | 8/9 Streets Crosstown | 2,142 | 2,107 | -1.60% | 162 |
| M9 | Avenue C/East Broadway | 5,257 | 5,333 | 1.40% | 132 |
| M10 | (Central Park West)/Frederick Douglass Blvd | 7,264 | 6,874 | -5.40% | 113 |
| M11 | 9 (Columbus) and 10 (Amsterdam) Avs | 10,877 | 10,152 | -6.70% | 78 |
| M12 | Eleventh/Twelfth Avs | 464 | 515 | 11.00% | 179 |
| M14 | 14 Street Crosstown | 32,868 | 30,558 | -7.00% | 8 |
| M15Lcl/SBS | First/Second Avenues | 46,029 | 44,797 | -2.70% | 2 |
| M20 | Lincoln Center/Battery Park City | 2,710 | 2,446 | -9.70% | 159 |
| M21 | Houston Street | 1,423 | 1,402 | -1.50% | 168 |
| M22 | Madison/Chambers Streets | 2,690 | 2,732 | 1.60% | 155 |
| M23Lcl/SBS | 23 Street Crosstown | 12,716 | 12,308 | -3.20% | 53 |
| M31 | 57 Street/York Av | 10,029 | 9,995 | -0.30% | 82 |
| M34/16/SBS | Jacob Javits Center via 34 Street | 15,080 | 14,901 | -1.20% | 39 |
| M35 | Randall’s Island/Ward’s Island | 1,369 | 1,038 | -24.20% | 171 |
| M42 | 42 Street Crosstown | 11,517 | 10,596 | -8.00% | 70 |
| M50 | 49/50 Streets Crosstown | 2,895 | 2,785 | -3.80% | 153 |
| M57 | 57 Street Crosstown | 6,139 | 6,065 | -1.20% | 122 |
| M60Lcl/SBS | La Guardia Airport via 125 Street | 16,697 | 16,751 | 0.30% | 31 |
| M66 | 66/67 Streets Crosstown | 11,810 | 11,195 | -5.20% | 66 |
| M72 | 72 Street Crosstown | 6,134 | 5,675 | -7.50% | 130 |
| M79 | 79 Street Crosstown | 14,660 | 13,892 | -5.20% | 47 |
| M86Lcl/SBS | 86 Street Crosstown | 23,576 | 24,746 | 5.00% | 18 |
| M96 | 96 Street Crosstown | 15,442 | 15,034 | -2.60% | 37 |
| M98 | Washington Heights/Upper East Side (Limited-Stop Service) | 1,790 | 1,863 | 4.10% | 164 |
| M100 | Amsterdam Av/Broadway/125 St | 16,412 | 17,006 | 3.60% | 30 |
| M101 | Third/Lexington/Amsterdam Avs | 26,167 | 24,275 | -7.20% | 20 |
| M102 | Third/Lexington/Lenox Avs | 12,739 | 12,292 | -3.50% | 54 |
| M103 | Third/Lexington Avs | 10,403 | 9,786 | -5.90% | 86 |
| M104 | Broadway/42 Street | 9,026 | 8,223 | -8.90% | 99 |
| M106 | 96/106 Streets Crosstown | 2,436 | 2,476 | 1.60% | 156 |
| M116 | 116 Street Crosstown | 10,147 | 10,296 | 1.50% | 76 |
| Other Manhattan routes | 380 | 302 | -20.50% | ||
| Manhattan Local routes | 424,707 | 410,479 | -3.40% |
Queens Local Buses: Average Weekday Ridership
| Route | Service Area | 2015 | 2016 | 2015-2016 Change % | 2016 Rank |
| Q1 | Springfield Blvd/Braddock/Hillside Avenues | 4,719 | 4,381 | -7.20% | 139 |
| Q2 | Belmont Park/Hollis Avenuee | 5,691 | 5,722 | 0.50% | 128 |
| Q3 | Farmers Boulevard/JFK Airport | 9,667 | 9,684 | 0.20% | 88 |
| Q4 | Linden Boulevard (Regular and Limited-Stop Service) | 9,379 | 9,242 | -1.50% | 93 |
| Q5 | Merrick Boulevard/Green Acres/Rosedale | 12,003 | 11,728 | -2.30% | 59 |
| Q12 | Sanford Avenue/Northern Boulevard | 10,889 | 11,099 | 1.90% | 68 |
| Q13 | Northern/Bell Boulevards | 8,610 | 8,516 | -1.10% | 95 |
| Q15 | 150 Street | 5,729 | 5,876 | 2.60% | 125 |
| Q16 | Bayside Avenue/Willets Point Boulevard | 4,052 | 4,054 | 0.00% | 145 |
| Q17 | Kissena Boulevard/Horace Harding Expwy/188 St | 17,237 | 17,224 | -0.10% | 29 |
| Q20 | Jamaica/college Point | 13,371 | 14,192 | 6.10% | 44 |
| Q24 | Atlantic Avenue/Broadway | 8,846 | 8,512 | -3.80% | 96 |
| Q26 | 46 Avenue/Hollis Court Boulevard | 1,397 | 1,466 | 4.90% | 166 |
| Q27 | 46 Avenue/Rocky Hill Rd/Springfield Boulevard | 24,516 | 24,580 | 0.30% | 19 |
| Q28 | Northern Boulevard/32 Avenue | 9,816 | 9,893 | 0.80% | 85 |
| Q30 | Utopia Parkway/Horace Harding Expressway | 10,243 | 10,555 | 3.00% | 71 |
| Q31 | Utopia Parkway/Bell Boulevard | 5,610 | 5,692 | 1.50% | 129 |
| Q32 | Roosevelt/Fifth Avenues | 9,942 | 9,454 | -4.90% | 90 |
| Q36 | Hillside/Jamaica Avenues | 5,943 | 6,101 | 2.70% | 120 |
| Q42 | Jamaica/Archer Av/Liberty Av/174 St | 1,195 | 1,195 | 0.00% | 170 |
| Q43 | Hillside Avenue | 14,840 | 14,853 | 0.10% | 40 |
| Q44Lcl/SBS | Jamaica, Queen/Bronx Park South, Bronx | 27,092 | 27,712 | 2.30% | 14 |
| Q46 | Union Turnpike | 21,647 | 21,468 | -0.80% | 24 |
| Q48 | Roosevelt Av/Ditmars Blvd/La Guardia Airport | 2,805 | 2,854 | 1.70% | 152 |
| Q54 | Jamaica/Metropolitan Avenues | 11,761 | 11,952 | 1.60% | 56 |
| Q55 | Myrtle Avenue (East) | 7,427 | 7,343 | -1.10% | 105 |
| Q56 | Jamaica Av | 8,003 | 7,862 | -1.80% | 102 |
| Q58 | Fresh Pond Rd/Corona Av | 29,027 | 29,412 | 1.30% | 10 |
| Q59 | Grand Street/Grand Avenue | 6,844 | 7,127 | 4.10% | 110 |
| Q76 | Francis Lewis Boulevard | 5,557 | 5,742 | 3.30% | 126 |
| Q77 | Springfield Blvd/Francis Lewis Blvd | 6,306 | 6,413 | 1.70% | 116 |
| Q83 | Liberty/Murdock Avenues | 8,827 | 8,664 | -1.80% | 94 |
| Q84 | Merrick Boulevard/120 Avenue | 4,528 | 4,441 | -1.90% | 136 |
| Q85 | Merrick Boulevard/Conduit Av | 12,150 | 11,820 | -2.70% | 57 |
| Q88 | Horace Harding Expwy/73 Av/Springfield Blvd | 10,529 | 11,010 | 4.60% | 69 |
| Other Queens local routes | 698 | 466 | -33.20% | ||
| Queens Local routes, total | 356,896 | 358,305 | 0.40% |
Staten Island Local Buses: Average Weekday Ridership
| Route | Service Area | 2015 | 2016 | 2015-2016 Change % | 2016 Rank |
| S40/90 | Richmond Terrace | 4,671 | 4,629 | -0.90% | 133 |
| S42 | St Marks Place/Bay Street | 905 | 914 | 1.00% | 172 |
| S44/94 | Richmond Avenue | 7,240 | 7,016 | -3.10% | 112 |
| S46/96 | Castleton Avenue | 7,626 | 7,299 | -4.30% | 106 |
| S48/98 | Forest Avenue | 7,975 | 7,702 | -3.40% | 103 |
| S51/81 | Bay Street/Father Capodanno Boulevard | 4,248 | 4,169 | -1.90% | 144 |
| S52 | Tompkins Avenue/Cebra Avenue | 3,615 | 3,450 | -4.60% | 149 |
| S53 | Clove Road/Verrazano Narrows Bridge | 9,497 | 9,378 | -1.30% | 91 |
| S54 | Manor Road | 1,447 | 1,315 | -9.10% | 169 |
| S55 | Annandale Road/Richmond Avenue | 390 | 355 | -9.00% | 181 |
| S56 | Richmond Avenue/Arthur Kill & Foster Rd | 532 | 515 | -3.20% | 179 |
| S57 | Rockland/Brielle/Bradley Aves | 1,494 | 1,436 | -3.90% | 167 |
| S59 | Richmond Avenue | 3,749 | 3,592 | -4.20% | 148 |
| S61/91 | Victory Boulevard/Bradley Av | 4,492 | 4,385 | -2.40% | 138 |
| S62/92 | Victory Boulevard | 4,386 | 4,431 | 1.00% | 137 |
| S66 | Victory Boulevard/Jewett Avenue | 1,677 | 1,659 | -1.10% | 165 |
| S74/84 | Richmond/Arthur Kill Roads | 5,512 | 5,411 | -1.80% | 131 |
| S76/86 | Richmond Road/New Dorp Lane | 4,724 | 4,617 | -2.30% | 134 |
| S78 | Hylan Boulevard | 6,211 | 6,163 | -0.80% | 119 |
| S79Lcl/SBS | Verrazano Narrows Bridge/Hylan Boulevard/Richmond Avenue | 11,070 | 11,378 | 2.80% | 62 |
| S89 | Richmond Av/Bayonne, New Jersey (Limited-Stop Service) | 781 | 756 | -3.20% | 175 |
| S93 | Clove Road/Verrazano Narrows Bridge (Limited-Stop Service) | 3,235 | 3,686 | 13.90% | 147 |
| Other Staten Island, buses | 310 | 279 | -10.00% | ||
| Staten Island Local buses, total | 95,787 | 94,535 | -1.30% |
Express Buses: Average Weekday Ridership
| Route | Service Area | 2015 | 2016 | 2015-2016 Change % | 2016 Rank |
| X1 | Hylan Boulevard | 5,963 | 6,019 | 0.90% | 2 |
| X2 | Hylan Boulevard | 1,639 | 1,550 | -5.40% | 10 |
| X3 | Hylan Boulevard | 500 | 486 | -2.80% | 23 |
| X4 | Hylan Boulevard | 628 | 645 | 2.70% | 19 |
| X5 | Hylan Boulevard | 1,849 | 1,865 | 0.90% | 8 |
| X7 | Hylan Boulevard | 1,815 | 1,753 | -3.40% | 9 |
| X8 | Hylan Boulevard | 862 | 817 | -5.20% | 16 |
| X9 | Hylan Boulevard | 1,198 | 1,105 | -7.80% | 12 |
| X10 | Richmond & Gannon Avs and Victory Blvd/Gannon Av | 2,784 | 2,825 | 1.50% | 4 |
| X11 | Richmond & Gannon Avs and Victory Blvd/Gannon Av | 724 | 705 | -2.60% | 17 |
| X12/42 | Watchogue Rd/Forest Av/South Av | 2,248 | 2,235 | -0.60% | 7 |
| X14 | Port Richmond & Forest Avs/Clove Road | 885 | 894 | 1.00% | 14 |
| X15 | Richmond Road/Arthur Kill Road | 1,242 | 1,149 | -7.50% | 11 |
| X17 | Richmond/Hugenot/Arden Avs | 5,812 | 6,114 | 5.20% | 1 |
| X19 | Richmond/Hugenot/Arden Avs | 940 | 1,018 | 8.30% | 13 |
| X21 | Richmond Av/Arthur Kill Rd | 393 | 488 | 24.20% | 22 |
| X22 | Bloomingdale/Amboy Roads (via Pleasant Plains) | 2,198 | 2,304 | 4.80% | 6 |
| X27/37 | Bay Ridge – Downtown/Midtown Manhattan | 3,121 | 3,106 | -0.50% | 3 |
| X28/38 | Sea Gate/Bensonhurst – Downtown/Midtown Manhattan | 2,616 | 2,634 | 0.70% | 5 |
| X30 | Forest Av/Victory Blvd | 843 | 860 | 2.00% | 15 |
| X31 | Travis Avenue/Forest Hill Road | 687 | 675 | -1.70% | 18 |
| X63 | Rosedale/Midtown Manhattan | 614 | 598 | -2.60% | 20 |
| X64 | Cambria Heights/Midtown Manhattan | 335 | 319 | -4.80% | 24 |
| X68 | Floral Park/Midtown Manhattan | 557 | 546 | -2.00% | 21 |
| Other express buses | 21 | 23 | 9.50% | ||
| Express routes, total | 40,474 | 40,733 | 0.60% |