Tim Evanson
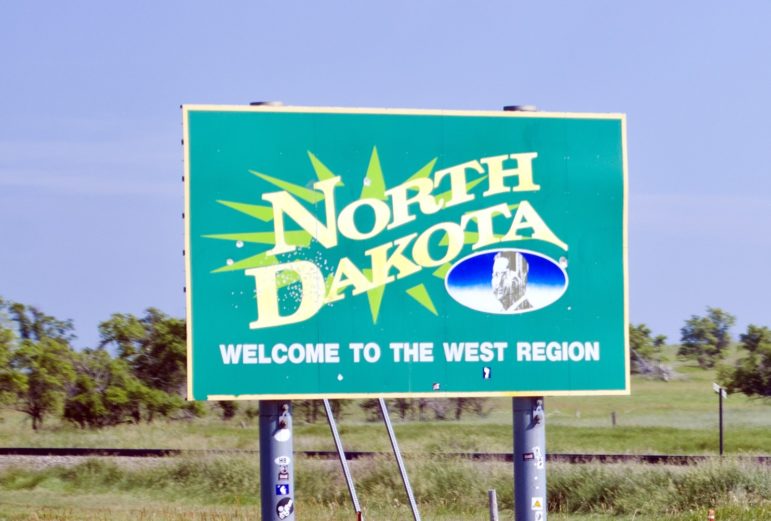
According to CFB records, $2,000 in candidate spending so far in the 2017 race went to addresses in North Dakota.
When reporters and good-government types talk campaign finance, they typically discuss the contributions that fund campaigns, and the impact those donations might have. But campaigns spend money as well as raise it, and that spending has an impact, too. Indeed, politicians who talk about creating jobs might not be able to deliver them for most people but almost all campaigns do create jobs–or at least work–for consultants, fundraisers, doughnut stores and the other mainstays of the modern political campaign.
The candidates for mayor, public advocate, comptroller, borough president and Council have so far in the 2017 election cycle spent nearly $47 million, according to the records of the Campaign Finance Board. About 70 percent of that money went to people and firms based in New York State. A few hundred bucks made it to firms based in Australia and Israel. Almost half the spending in New York state went to just 10 ZIP codes.
Here’s a look at where New York’s campaign money has been spent so far in 2017:
| ZIP code | Spending |
| 11231 | $5,089,258 |
| 11201 | $3,251,659 |
| 10038 | $1,951,722 |
| 10016 | $1,266,316 |
| 10014 | $925,902 |
| 10034 | $732,007 |
| 10003 | $579,493 |
| 10004 | $519,772 |
| 11238 | $496,145 |
| 10013 | $481,695 |
If you want to see the full breakdown by ZIP code, click here. About $85,000 in expenses within New York State had no ZIP code listed.
| State | Spending |
| New York | $33,463,357 |
| Illinois | $4,409,711 |
| Pennsylvania | $1,720,969 |
| Washington, D.C. | $1,600,740 |
| New Jersey | $973,773 |
| California | $741,194 |
| Texas | $560,304 |
| Minnesota | $293,061 |
| Florida | $277,111 |
| Connecticut | $267,957 |
| Virginia | $262,327 |
| Iowa | $196,782 |
| Massachusetts | $187,494 |
| Louisiana | $103,964 |
| North Carolina | $102,918 |
| Colorado | $72,300 |
| Arizona | $64,307 |
| Georgia | $50,203 |
| Washington | $48,304 |
| Maryland | $19,519 |
| Ohio | $18,346 |
| Wisconsin | $18,054 |
| South Carolina | $15,326 |
| New Hampshire | $14,933 |
| Arkansas | $14,051 |
| Puerto Rico | $12,744 |
| Utah | $11,789 |
| Maine | $10,498 |
| Michigan | $8,900 |
| Vermont | $8,199 |
| Tennessee | $5,740 |
| Kentucky | $3,404 |
| Nebraska | $3,315 |
| Missouri | $2,671 |
| Nevada | $2,039 |
| North Dakota | $2,000 |
| Oklahoma | $1,556 |
| Idaho | $1,500 |
| Delaware | $956 |
| South Dakota | $349 |
| Rhode Island | $339 |
| Oregon | $193 |
| Alabama | $125 |
| New Mexico | $41 |
About $1.4 million in campaign spending had no state listed.


