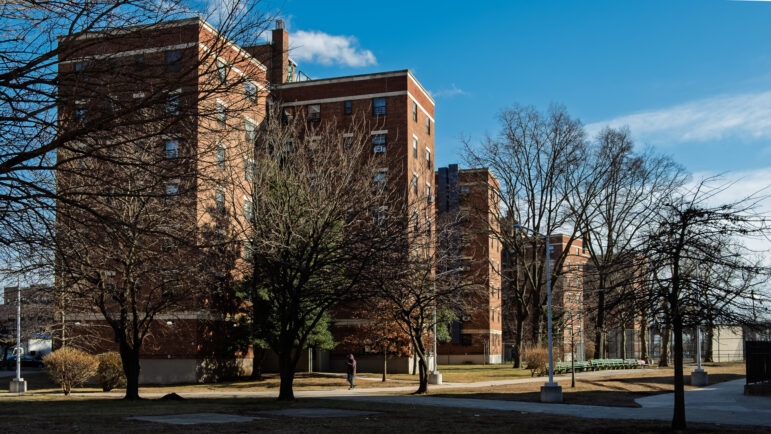
Photo by: DOE
Only a third of parents at this C-graded Bronx school turned in the surveys that determine a school’s “environment” grade. So how does one compare this school to others where more than 90 percent of families weighed in?
Last week, the New York City Department of Education announced it was evaluating the futures of dozens of schools which had earned bad grades in the department’s annual progress reports.
This was welcome transparency compared with the early years of Progress Grades, when DOE announced school-closing lists as faits accompli, without community feedback or participation.
But while the public is learning more about what might be done after this year’s round of progress reports, understanding of the reports themselves is not widespread—largely because the reports employ a complicated formula that has evolved since 2007, when the DOE began rating city schools with letter grades.
Here’s a tip sheet for understanding what DOE holds most important in the lives of New York City students.
Grading system changes often
In the beginning, under the direction of Columbia University law professor (on loan to DOE as Chief Accountability Officer) and public school parent James Liebman, schools got a single, bold-faced grade, A to F. Since 2008, however, the school’s report card suggests a student’s report card—with different grades in different areas, calculated into an overall grade.
Liebman and then-Chancellor Joel I. Klein wanted the Reports to permit parents and school officials to easily compare schools from year to year. But that’s been made difficult by a series of changes to the yardstick against which schools are measured.
Every year, the criteria by which grades are determined have been tweaked by DOE. Some years, grades have been “curved,” as they were last year, when more rigorous standardized tests led to plummeting test scores that would have doomed hundreds of city schools to letter-grade failure.
In other years, grades have been determined solely by the DOE formula, as was the case this year, when 60 percent of schools earned As and Bs and 10 percent Ds and Fs, evoking, for some critics, a version of Garrison Keillor’s Lake Wobegon effect, where (nearly) all the children are above average.
Three components to the grade
There are three major tributaries to a school’s progress grade: environment, performance and progress.
Environment is shorthand for what the school looks and feels like, and for its expectations of students, parents, and faculty.
Performance is defined as the school’s overall achievement on standardized test scores, given annually in third through eighth grade.
Progress is the increment gained in a year—how much a student, or a specific cohort of students, moves up in proficiency levels, over a year of instruction.
Additionally, school scores are compared with peer school scores, so that schools serving more high-needs students, for example, aren’t unfairly compared with schools serving predominantly gifted and talented youngsters.
Surveys play major role
A school’s environment accounts for only 15 percent of the overall grade, and is informed in large measure by school-survey results gathered and analyzed by the DOE.
Response rates vary widely across city schools, making true comparisons difficult. But even in schools where small fractions of teachers and parents complete surveys, the answers that are provided stand in for the whole voice of the school community. So the proactive can have outsize influence on outcomes.
For example, at the A-graded Academy of Public Relations in the Bronx, nearly 90 percent of parents responded to the survey—compared with just over half citywide, and only about a third of parents at the C-graded Fannie Lou Hamer Middle School, also in the Bronx.
There is no way to protect the survey against under-reporting or self-selected reporting, where (for example) a group of parents might coordinate their responses to complain about school discipline, homework policy or communication.
The survey also includes teacher opinions, with the same caveats and concerns: When the response rate is low, do the answers reflect the whole picture?
Progress valued highly
Progress is the most important value of the Progress Report. It accounts for 60 percent of a school’s overall score.
This year, the DOE measured and rewarded academic progress made by boys of color, historically among the lowest-achieving public school students. And as in previous years, also eligible for extra credit are schools that bring the highest-need students forward—children with special needs and those new to the English language.
But the emphasis on progress means schools with low scores one year that make significant gains can show outstanding progress—while consistently high-achieving schools have more difficulty demonstrating the dramatic gains that earn Progress As.
Consider again the Academy of Public Relations in the Bronx, which earned an A grade overall and an A in student progress. Yet only 21 percent of its students earned “proficient” or higher scores on the state’s English test; 38 percent scored proficient or above in math. So while the school’s scores unarguably rose from the previous academic year, does a school where fewer than half of students meet basic proficiency merit an A?
Compare that shining A with the more modest B earned at the Upper West Side’s PS 87. At PS 87, 84 percent of students meet or exceed proficiency in both Math and English. But the school’s history of solid achievement works against its “progress” gains: Without big leaps in test scores—exceedingly hard to achieve when most students already surpass state benchmarks—big progress gains are elusive.
Also worth noting is DOE’s singling out of charter-school gains. Charters earned more As than traditional public schools, Chancellor Dennis Walcott said, and more than half of middle-school charters got As. But about a third of elementary and middle-school charter schools got no progress grade at all, either because the schools were too young to be graded or didn’t yet have children in the testing grades. So when only two-thirds of schools are graded, is it fair to generalize across all charters—or does a less-monolithic, more nuanced approach better suit the complexities of urban school reform?
After the grades
While doubts persist about what the school grades actually reveal about a specific school’s life, culture, academic expectations and achievement, there is universal agreement that the grades are a fixture of the current administration, and that their outsize effect can doom, or bless, the city’s nearly 1,700 schools.
Indeed, despite the changes since 2007, one thing has remained constant: F and D schools are at risk of closure—and schools with three consecutive Cs can also be targeted as failures and shuttered. Even as the grading goalposts move, the consequences for schools remain constant.


