A new data tool by the School of Industrial and Labor Relations at Cornell University breaks down a trove of housing-related data for each of the state’s Senate and Assembly districts. It comes just over a week before the state budget deadline, in a year dominated by debates over how elected officials should address New York’s affordable housing shortage.

Adi Talwar
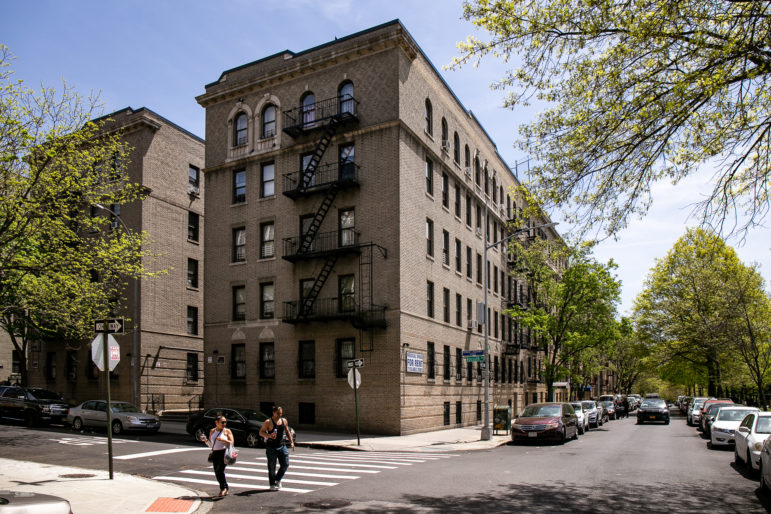
Apartment buildings along East Mosholu Parkway North and Kossuth Avenue in The Bronx.How many renters are your state lawmakers accountable to, and how many faced eviction last year? How many homeowners live in your district? How old is the housing stock there?
These are the sort of questions New Yorkers can answer using a new data tool published Thursday by the School of Industrial and Labor Relations at Cornell University.
It comes just over a week before the state budget deadline, in a year dominated by debates over how elected officials should address New York’s affordable housing shortage.
The Eviction Filings Dashboard was designed by Russell Weaver, research director at Cornell ILR’s outpost in Buffalo, New York, called the Buffalo Co-Lab. Eviction filing data is pulled from a state courts database, and is complemented by U.S. Census data.
While Cornell does not take a position on legislative matters, the statewide tenant coalition Housing Justice for All provided input on which demographic data to include, according to Weaver. The dashboard links to the group’s platform, as well as that of the Right to Counsel coalition, which advocates for attorneys for all tenants facing eviction.
Advocates can use the dashboard to apply pressure to their elected officials, Weaver said. But he also hopes lawmakers will explore it unprompted to get a clearer picture of the renters facing housing instability in their districts.
“One thing that is difficult, if not impossible, to ascertain from the data put out by the New York State Office of Court Administration is who’s being impacted by eviction filings,” he told City Limits.
“And so the idea was, while we can’t answer that question very concretely and clearly with the data we have, we can at least look at the locational context of where eviction filings are happening and get to know who lives there,” he continued. “And then start to make connections about who is more likely to be affected by high eviction filing rates.”
Of the five senate districts with highest rates in 2022, three are in New York City – represented by Democrats Gustavo Rivera and Luis Sepulveda of the Bronx, and Robert Jackson in Upper Manhattan. The group also includes Suffolk County Democrat Monica Martinez and Buffalo Democrat Tim Kennedy, who have majority-homeowner districts.
Filing rates outside New York City may be an undercount, Weaver said, since the state data doesn’t include filings from town and village courts. Other demographic details on the dashboard include race, poverty rate, and family composition.
Housing Justice for All’s platform includes a good cause eviction bill, which would give tenants recourse to challenge eviction in court absent rent debt or nuisance behavior, as well as contest rent increases above a certain level. The group is also pushing for a new housing voucher program, and a bill that could help tenants purchase their buildings.
Gov. Kathy Hochul has not endorsed the platform, though the Senate and Assembly have signaled that they would like to see tenant protections worked into the final budget deal, due April 1.
The Senate referenced good cause eviction in its budget resolution, despite opposition from real estate trade groups including the Homeowners for an Affordable New York coalition, which has dismissed the measure as “an ideologically-driven pursuit by far-left socialists” that would prevent the rent increases needed to keep up with repairs.
Julie Colon, lead housing organizer with the Northwest Bronx Community & Clergy Coalition, a Housing Justice for All member, said she hopes Assembly Speaker Carl Heastie, who represents neighborhoods in the East Bronx, will see the dashboard.
According to the tool, most of Heastie’s constituents are renters, and the majority of the rental units in his district are unregulated, meaning landlords can increase rents without adhering to annual limits as they must in stabilized buildings.
“If there was anybody I’d say, ‘Hey, you need to be paying attention to this,’ he has the power to have the legislature vote on these bills and get people rallied up around them,” Colon said.
State Assembly District 83: Scroll horizontally to see full data
Data from the Cornell ILR Eviction Filings Dashboard for State Assembly District 83 in The Bronx, represented by Speaker Carl Heastie.
To track the share of stabilized housing within New York City, Weaver drew on 2021 data collected by Asher Ross, a member of the Housing Data Coalition which centralizes government agency data for tenant organizations and researchers.
One of the coalition’s tools scrapes tax bills from the city’s Department of Finance that feature rent stabilization information self-reported by landlords to the state housing agency Homes and Community Renewal, or HCR.
A representative of HCR said the Department of Finance filings aren’t an accurate reflection of rent stabilization registration data it collects, and that drawing inferences from them would be misleading. Privacy law shields HCR’s data from the public.
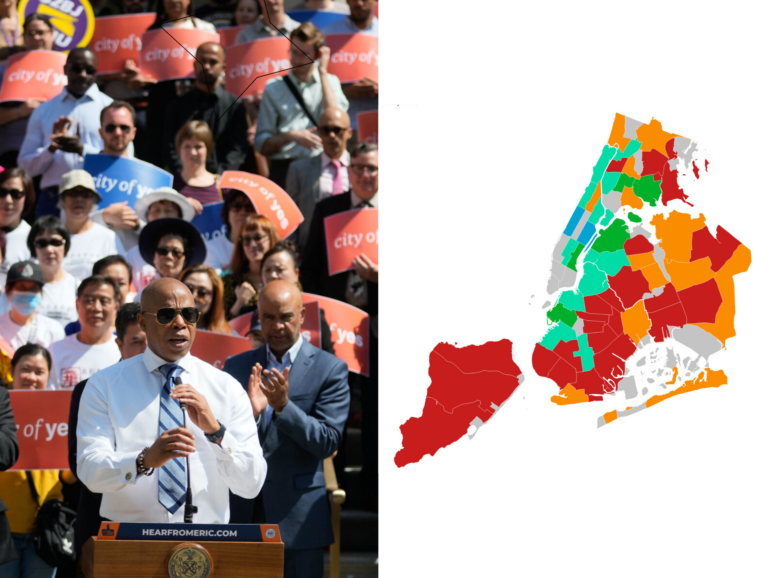
Weaver collected data on public and other federally-assisted housing from the National Housing Preservation Database. In New York City, he assumed no overlap between federally-assisted and stabilized units. Stabilized units outside of New York City—in Nassau, Westchester, Rockland, and Ulster counties—are not reflected in the map.
Tenants can also use the dashboard to explore statistics about the types of eviction cases filed in their local court last year, including the median amount of unpaid rent sought by landlords, and how many cases were brought by an individual landlord, versus a corporation or an agency. Heat maps show how many cases were filed per zip code.
Liz McGriff is an organizer with the Rochester City-Wide Tenant Union, another Housing Justice for All member group. In 2022, the median claim for unpaid rent in the Rochester City Court—based on “primary claim” data extracted from state court records —was $2,926.39.
“It puts people in a place of —you feel hopeless,” McGriff told City Limits. “How are you going to pay this? Are you going to put it in the rent or are you going to feed your children?”
Median claims in New York City’s housing courts were higher last year, ranging from $3,781.50 in Staten Island on the low end to $5,965.00 in Manhattan.
Another dashboard filter shows counties where the rate of eviction filings increased in 2022 compared to 2019. Such rates didn’t surpass pre-pandemic levels in New York City last year, but they did, at least slightly, in 40 counties outside the five boroughs —from Western New York to the Hudson Valley and up to the Canadian border.
One of the regions to see the largest increase in eviction filing rates was rural Sullivan County in the Catskills—from nearly 5.7 to 8.3 per 100 renter households, an increase of 2.54 percent.
Marcie Kobak of Legal Services of the Hudson Valley, whose team serves part of the county, theorized that major changes to state housing laws in 2019, including new notice requirements for rent increases and lease terminations, may have deterred landlords from filing evictions for a stretch of time.
Few renters in Kobak’s Sullivan County coverage area live in regulated housing, she said, meaning recourse against an eviction without cause is “just about as thin as it gets.”


