“How the state defines ‘disadvantaged’ is often unjust, and inaccurate. In Manhattan, Hudson Yards and much of the High Line qualify as disadvantaged, while many communities of color in Queens do not.”

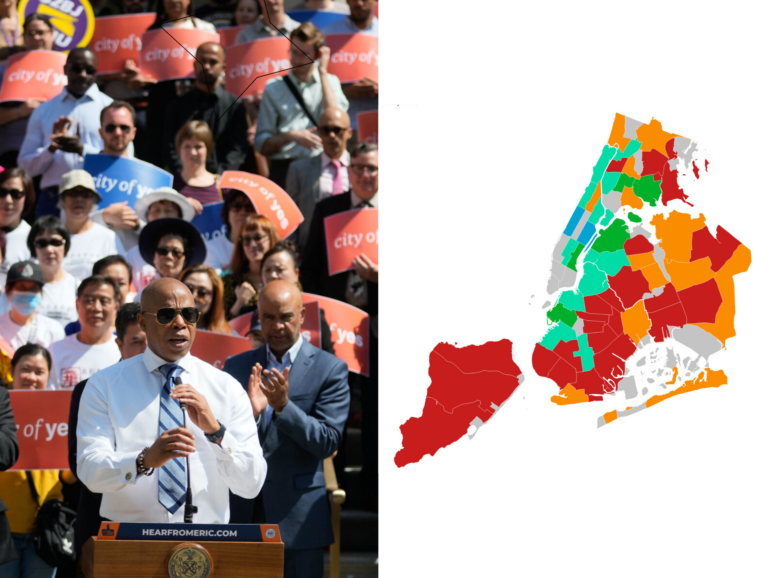
Michael Appleton/Mayoral Photography Office
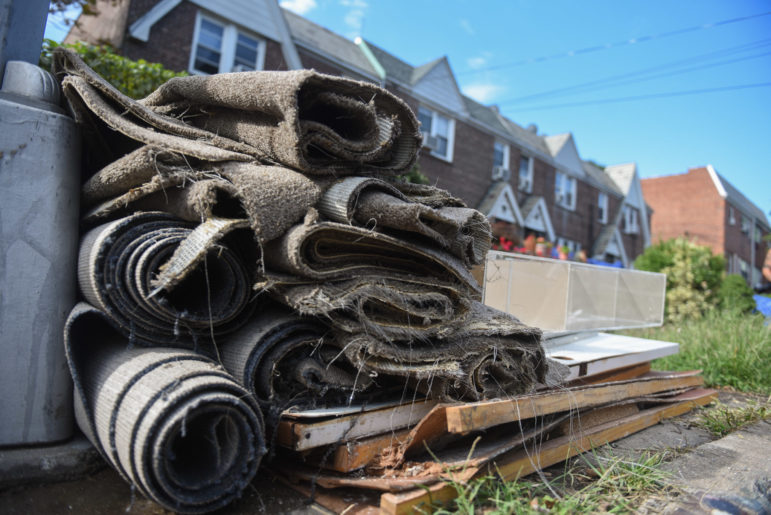
Flood damage in Woodside, Queens, following Hurricane Ida in 2021.*Editor’s note: This piece was updated after publication to include the state’s extended deadline for the public comment period. The public can now weigh in on NY’s draft disadvantaged communities criteria until Aug. 5, 2022. More information can be found here.
 CityViews are readers’ opinions, not those of City Limits. Add your voice today!
When it comes to climate change and its dire effects in New York, which households and communities are the most vulnerable?
Under the 2019 Climate Leadership and Community Protection Act (CLCPA), the state must drastically reduce greenhouse gas emissions by 2050, with “disadvantaged communities” receiving at least 35 percent of investments from the $300 billion required for the green transition. This provision has established New York as the national leader in climate justice, and demonstrates the state’s commitment to increasing the resilience of New Yorkers who are most susceptible to climate change due to factors like racism, poverty, and proximity to industrial sites. The earmarked benefits, including green jobs and community-owned solar energy, will also serve as reparations for ongoing environmental harms.
But how the state defines “disadvantaged” is often unjust, and inaccurate. In Manhattan, Hudson Yards and much of the High Line qualify as disadvantaged, while many communities of color in Queens do not.
These discrepancies are not limited to the five boroughs: Baldwin Harbor in Nassau County has large Black and Latinx populations and is at high risk for coastal flooding, but is not designated as disadvantaged. By contrast, some affluent, segregated white communities on Long Island qualify in the current system as disadvantaged, because they neighbor marginalized communities of color, including the Shinnecock Tribal Nation’s territory in the Hamptons.
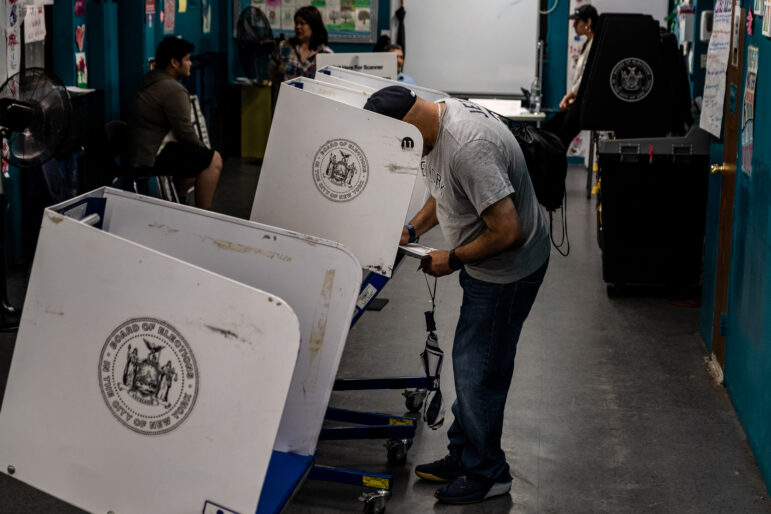
New Yorkers now have the opportunity—and responsibility—to help the state move toward true climate justice by submitting our input (in person, virtually, or in writing) on these community designations. Public participation has so far been abysmal: Only four people testified at New York City’s in-person hearing on June 14. But it’s not too late: The comment period is open until Aug. 5.*
In 2020, New York hired out-of-state consultants to create the present map of disadvantaged communities using a data-driven model. Each of the state’s 4,919 census tracts has received a numerical score based on its relative performance over 45 combined variables, such as air quality and racial demographics. The highest scoring tracts have been designated disadvantaged.
Overall, the state’s strategy has privileged statistics over lived experiences. While the consultants did confer with the Climate Justice Working Group (CJWG), who approved the draft map, the state limited the CJWG’s number of activist members. As a result, many vulnerable communities did not have a voice in the map-making process.
Unfortunately, the census tract approach makes the misclassification of households inevitable, by erasing differences within population-dense tracts, such as gentrifying ones in New York City.
In other places, the map splits cohesive neighborhoods, designating only portions disadvantaged. In South Ozone Park, a sewage backup flooded nine blocks in a working-class community of color in 2019. Three census tracts converge on these blocks, and the draft map codifies only one as disadvantaged. Of the excluded tracts, one borders two highways that are major sources of air pollution: the Belt Parkway and the Van Wyck Expressway.
The data on which the state’s model relies can also be misleading. The present formula understandably treats coastal flooding risk and contiguity to industrial remediation sites (like brownfields) as indicators of disadvantage. However, as my colleague Queens College Professor Melissa Checker points out, such indicators have cast hotspots of post-industrial waterfront development, including Hudson Yards, as disadvantaged.
Troublingly, at least one of the model’s datasets appears inaccurate. During Hurricane Ida last September, an Indo-Trinidadian mother and her son drowned in their basement apartment on 183rd Street in Hollis. In the same storm, a Nepalese family of three, including a two-year-old boy, drowned in another basement apartment on 64th Street in Woodside. And yet, the census tracts for both of these blocks scored in the 0 percentile for “inland flooding risk areas.” Neither is considered disadvantaged.
Finally, the 45 variables are insufficient and miss measurements of community disadvantage, including airport impact. Although located next to John F. Kennedy International Airport, most census tracts in Brookville, Laurelton, Rosedale, and Springfield Gardens are not classified as disadvantaged. Barbara Brown, chair of the Eastern Queens Alliance (EQA), says that all tracts near the airport should be included because of the constant air and noise pollution from low-flying planes that regularly shake area homes. Community members must contend with 18-wheel, diesel-fueled trucks that support next-day deliveries and off-airport warehouses. Residents of these tracts are predominantly Black and score between the 93rd and 100th percentiles for low birthweight in the state.
Last November, the consultants acknowledged major flaws in the draft map when they reported that 48 percent of New York’s low-income households did not live in “disadvantaged” census tracts. The CJWG, then, decided to supplement the map by classifying all households making less than 60 percent of state median income (SMI) as disadvantaged, regardless of location.
This is an important, but limited, solution to the draft map’s problems in the New York City region. It gives more people access to individual benefits, such as subsidies for electric appliances, but not to neighborhood upgrades accruing from geographic investments, like improved public transportation. This intervention also fails to help many in the metro region who make more than 60 percent of SMI ($32,748 for a single person; $62,988 for a family of four), but still struggle financially because of our high cost of living. Moreover, sociologists like Thomas M. Schapiro establish that disparities in wealth—not just income—explain racial inequality in the United States.
Given the discrepancies between the draft map and the firsthand knowledge of many New Yorkers, it is imperative that more of us review and, if necessary, refute the current version through public comment. An interactive draft map, with disadvantaged communities in purple, makes it possible to see how your neighborhood and others fared. Begin by putting a zip code in the map’s upper left-hand search field. When you click on a census tract, you can learn its performance over the 45 indicators.
State officials need our help to achieve climate justice.
Natalie Bump Vena is an assistant professor in the department of urban studies at CUNY Queens College.


3 thoughts on “Opinion: Which NY Communities Are Most Susceptible to Climate Change Harms? Weigh In By Aug. 5”
Thank you so much for raising this issue! I am a Board Member of Civics United for Railroad Environmental Solutions, Inc., a Queens-based nonprofit that advocates for improvements in public health and the environment through modernization of freight rail equipment, facilities, and operations. I am one of the four people who testified at the NYC hearing. The hearing took place before a judge — so presumably these maps will have the force of law when it’s time to hand out millions of dollars. Leaving chronically underserved and overburdened Southeast Queens and other overburdened areas of Queens off the map, while including Hudson Yards, piles on injustice. For the mapping, CURES testified about including pollution from rail yards. Because of the advanced age of the locomotives that are being used by the Long Island Rail Road, the New York & Atlantic Railway, and Providence and Worcester, the locomotives are very high-polluting. How much of a problem is this? Repowering these ancient fleets to modern Tier 4 Switch Duty Cycle standards would get rid of at least 95% of this pollution — the NOx equivalent of a million cars. There is also needless particulate pollution blowoff from uncovered rail cars of crushed Construction & Demolition Debris waste, and explosively loud noise from all-night freight rail operations. This is why CURES testified that communities within a 1-mile radius of yards and neighborhood tracks used for yard operations, where pollution and noise are worst, are Disadvantaged. I hope that city and state elected officials will examine these maps in detail and demand justice for their constituents. And in addition to mapping, the NYS Governor and DEC need to act, as California already has acted, to take railyard and locomotive pollution seriously, and start eliminating the use of old locomotives in NYS, including those owned by the MTA-LIRR and its freight rail concessionaire.
Climate change impacts such as sea level rise and coastal storms put New York City at risk. Extreme weather occurrences might have unanticipated consequences that must be factored into future resiliency planning.
??