A version of this story originally appeared in Spanish.
Lea la versión en español aquí.
“It is now apparent,” says Laird Bergad, “that income distribution has already returned to the pre-Great Depression era pattern of extreme concentration.”
That’s not big news—income inequality is a well-known story. What hasn’t been examined closely is how the nationwide pattern of the rich getting richer and the poor staying poor looks when analyzed through a racial lens.
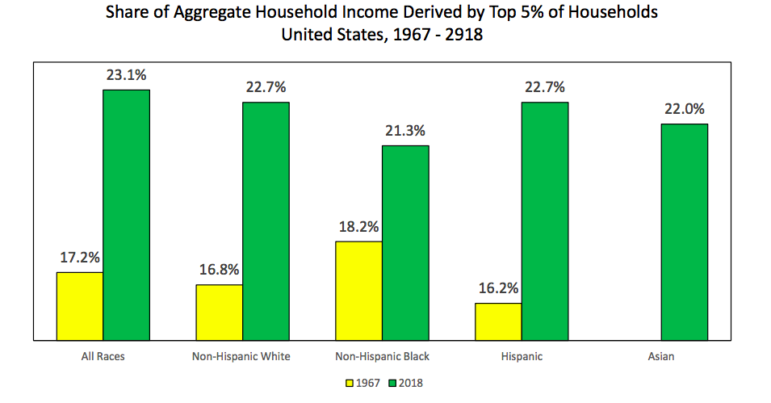
Bergad is the director of the Center for Latin American, Caribbean, and Latino Studies at the CUNY Graduate Center (CLACLS). A recent CLACLS report shows how between 1967 and 2018 inequality in the United States has become increasingly pronounced, across racial groups.
Overall, the upper 5 percent of all household income earners experienced a 125 percent increase in mean income between 1967 and 2018. And across the races, the top 5 percent of household-income earners are those who have seen the greatest growth.
Looking at the top 5 percent, the racial group that saw the highest growth in mean household income in inflation-adjusted was Hispanics with 111 percent, followed by non-Hispanic Whites with 108 percent and non-Hispanic African Americans with 93 percent. [Editor’s note: Because the data used by CLACLS uses the term “Hispanic,” this article uses that term and Latino interchangeably.]
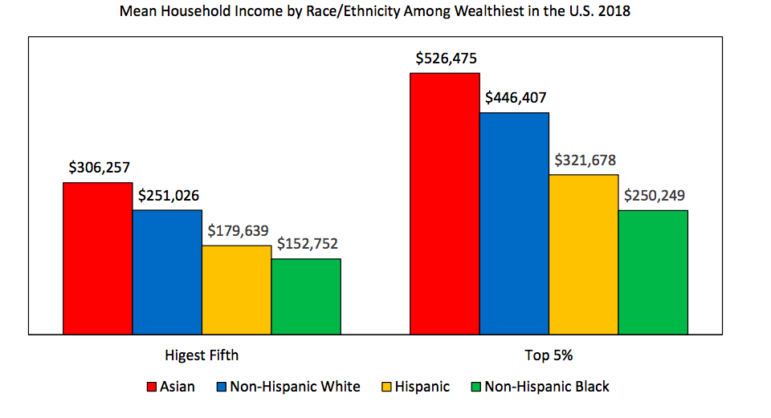
But while wealthy Latinos saw the sharpest growth in income, their average incomes still trailed Whites and Asians. The mean household income for the upper 5 percent of Asian households in 2018 was $526,475 dollars; for non-Hispanic White households it was $446,407 dollars. Wealthier households within the Latino community earned considerably less, at a mean income of $321,678 dollars. For African-American households it was $250,249 dollars.
According to Bergad, there are multiple reasons that could have facilitated income growth among those who were at the top.
While there has been extraordinary economic growth in the United States according to the Dow Jones industrial index, which was below 1,000 points in 1967 and now approaches 28,000 points, this does not necessarily mean that there has been simultaneous social and economic development. Statistical indicators such as the Gini coefficient, which measures the inequality from 0 to 1.0 point (in which maximum inequality equals 1.0) in the United States shows that between 1967 and 2018 this indicator increased from 0.40 to 0.49. The gap between the richest and poorest households is now the largest in the last 50 years.
Moving down the economic ladder to analyze what might be considered middle-class incomes, there was not much difference in income growth between Hispanics at 41 percent and non-Hispanic whites at 42 percent. On the other hand, it is worth noting that the average income of non-Hispanic African American households in that tier grew 58 percent.
Clearly, the most striking differences are among the household incomes of the poor. For example, Hispanics had the lowest growth in the working-class second quintile—the fifth of the population with incomes between the 20th and 40th percentile, where their median income grew 19 percent, non-Hispanic Whites 23 percent and non-Hispanic African Americans 41 percent.
The explanation, says CLACLS researcher Sebastián Villamizar-Santamaría: “The strongest impact is that Latinos stay in low-paying jobs. That could be because they don’t get enough credentials because they don’t go to school or because they don’t want to hire them because of some racial bias.”
Among the bottom fifth of households according to income, Latinos saw no growth in average household income in inflation-adjusted between 1967 ($12,357) and 2018 ($12,409). By comparison, the poorest non-Hispanic Whites saw growth of 23 percent, while among non-Hispanic African Americans it was 12 percent.
If these trends do not change and it endures as they have been in recent years, the outlook for the poorest Latinos is “that they will continue to have worse jobs that pay less and that in turn will end up reproducing cycles of poverty,” says Villamizar-Santamaría.
One of the unresolved questions is how to explain a 0 percent growth among the poorest Latinos. And what anchors them to the bottom? According to professor Bergad, “there are many factors to consider, including, the lack of political representation, the lack of education because Latinos have a low rate of college graduation, and the lack of political participation because most don’t vote —and therefore they have no voice.”
If you wish to read the report, click here.


