Share This Article
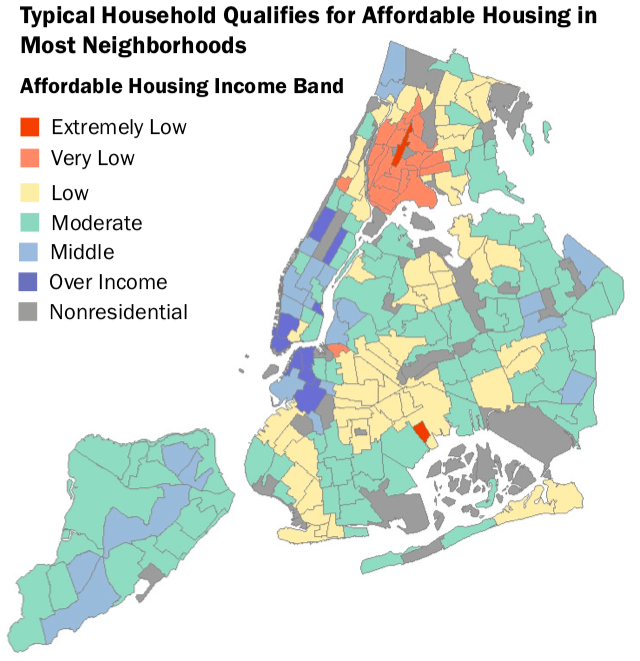
Most of the apartments built or preserved through the de Blasio administration’s housing plan were affordable to households with incomes at or below what’s typical in their neighborhoods, according to a reportreleased last week.
However, roughly a quarter of the apartments under the mayor’s plan—which has been underway since 2014 and aims to build or preserve 300,000 units of income-targeted or “affordable” housing—had rents that were more than a neighborhood’s typical household could afford.
The detailed study by the city’s Independent Budget Office set out to address questions that have dogged the de Blasio plan, as they dogged the Bloomberg administration’s housing plan before it.
“Although the city is on track to finance housing at a scale unprecedented in its history, advocates and elected leaders have questioned where this housing is being located and for whom it is priced,” the report said. “A prominent concern is whether housing is reserved for household incomes that would allow local residents to qualify. This question ties into larger debates around the equitable distribution of affordable housing across the city, gentrification of city neighborhoods, and affordable housing lottery priority for local residents.”
The IBO study is likely the most detailed and nuanced examination of the affordability impact of the mayor’s plan. However, it’s not clear the report fully answers the questions skeptics have raised about the plan, because it doesn’t talk about how the needs of all families in each neighborhood matched up with the apartments provided there.
The report analyzed neighborhoods where almost 78,000 housing units were created and financed under the city’s affordable housing plan from 2014 to 2017 and compared their income restrictions with the income of a “typical” household in the area, meaning a household with the median income and median number of household members found in the neighborhood.
It found:
•Just over half of the housing financed during the period is located in a neighborhood where the typical household earns too much to qualify for the affordable housing located there. While this means the typical household is not eligible for the housing, neighborhood households poorer than the typical household may qualify.
•Nearly a quarter of the units financed over the period are located in neighborhoods where the typical household does not earn enough to qualify for the housing.
•The remaining 25 percent of units financed during this period are located in neighborhoods where the typical household would meet the income-eligibility limits, although poorer residents in those neighborhoods would likely not earn enough to qualify.
The city’s Department of Housing Preservation and Development (HPD) said the report illustrated a number of competing concerns that the city considers in determining the appropriate level of affordability in neighborhoods.
There is the tradeoff between building housing for low-income households versus moderate-income families: The former are more expensive to subsidize, restricting total production under the plan. There is the choice of whether to build in low-income or high-income neighborhoods; the latter does more to economically integrate neighborhoods, but means higher land costs. And there is the complex interplay between goals of economic and racial integration and the risks of gentrification and displacement.
“This report acknowledges the many factors that we take into account when making sure the affordable housing opportunities the city is creating at a record pace meet the needs of our communities,” HPD told City Limits in a statement. “We are working on multiple fronts to ensure low-income New Yorkers can stay in their neighborhoods and have opportunities to move by locking in existing affordability, building aggressively on public and private sites across neighborhoods, and securing policies like Mandatory Inclusionary Housing and a reformed 421a that will secure affordability in some of the most expensive areas of the city.”
Taken at face value, the IBO report suggests most of HPD’s housing is not priced out of reach of typical residents in the targeted neighborhoods. This could be seen as rebutting a major criticism of the mayor’s plan.
Advocates, however, wondered why any units produced under a housing plan crafted during a severe housing crisis would be priced beyond the reach of typical households in any neighborhood.
[cl-newsletter]
“Just like most things the government (federal, state or city) produces, there is always a population that seems to be left out each time there’s even a small opportunity to help poor and working-class people, especially when they are [people of color] and immigrants,” said Nova Lucero, a tenant organizer with Northwest Bronx Community and Clergy Coalition. She added, with a touch of irony: “It is not enough that most people are rent-burdened or being sent to housing court or live in terrible housing conditions. We still don’t deserve more housing opportunities.”
The report also explained the complex process that creates the Area Median Income (AMI) that is applied in the affordable housing plan, often to the chagrin of residents and advocates.
The U.S. Department of Housing and Urban Development (HUD) calculates AMI using Census data from the five boroughs, Putnam, Rockland, and Westchester counties to determine the median family income for the New York HUD Metro Fair Market Area. Since those counties have higher median incomes than the city, a weighted average creates a higher AMI than would exist if the city were evaluated on its own. But even if the regional data weren’t included, New York’s AMI would be higher than the city’s true median income—and far higher than the median incomes in many neighborhoods—because HUD adjusts it upwards to account for high housing costs in the city. And there’s a final wrinkle: When adjusting AMI to apply to different family sizes, HUD’s method creates AMI levels that are tens of thousands of dollars higher than the Census Bureau’s.
“We struggle with AMI because [the calculations] leave our members out of the equation,” says Community Action for Safe Apartments (CASA) director Sheila Garcia, who notes that AMI is not localized for the communities that organizations like hers serve. Several federal housing subsidies are tethered to AMI, but the city ultimately decides what income levels to use, IBO notes. Says Garcia: “The city could build housing for people that are living in those neighborhoods and can actually afford those units.”
Some advocates said the IBO report, by focusing on the relationship between the “typical” household in a neighborhood and the income distribution of affordable housing offered there, fails to account for how the housing offered matches the volume of need in each area.
“This report fundamentally ignores the real numbers of how many people are being helped (or not helped) by the city’s so-called ‘affordable housing’ program. [It] the report completely omits how many people are actually in those income bands, let alone any metrics on displacement or neighborhood demographics,” says Charlie Dulik, youth organizer for Churches United for Fair Housing.
Dulik said every family CUFFH helps falls into one of the lowest income categories. “Consequently, it’s clear that keeping people in their current residences is even more critical than furthering this inadequate program,” he says. “When people get pushed out of their homes, they are not able to stay in the area to wait for units to eventually get built, for the housing lottery to maybe eventually come through after waiting for years.”
Picture the Homeless, an organization dedicated to empowering and providing resources for homeless New Yorkers, says broad income categories gloss over the mismatch between the city’s offerings and the incomes of needy people. A spokesperson says PTH members often lose out in housing lotteries. “If someone is making $10,000, then they are competing with someone making $30,000. [The mayor’s plan] is not addressing the fundamentals the city needs to [undertake]. This is not dependable or consistent,” said a PTH spokesperson.
According to HPD, since the period covered by IBO’s data ended in June 2017, the agency created or preserved another 44,000 units, which are serving even more low-income New Yorkers. Last year, the city’s housing agency, financed 34,160 units, of which 60 percent serve families making less than $47,000 for a family of three, and additionally HPD said almost 85 percent of the 122,000 units financed to date serve low-income residents. It also expects the policy to fully flourish when units created under MIH and the reformed 421a come online, many of them in higher-income, higher-opportunity neighborhoods.
The Independent Budget Office report can be read in detail here.