New York City is a Democratic town, but devotion to the donkeys—or to the two-party system—is far from uniform. The chart and pretty pictures below make this clear.
The Bronx is the bluest borough, in terms of proportion: Dems made up 78 percent of active registered voters there in an April 2017 count by the New York State Board of Elections. Brooklyn was next with 71 percent Democratic registration. But in terms of raw numbers, Brooklyn showed the most blue. More than 1 million active registered Democrats call the borough home.
Staten Island is known as the city’s most Republican borough, but it’s not actually Republican: Democrats are still the largest party (44 percent) but the GOP registration (30 percent) is higher than in any borough. Where Richmond County really stands out is the small but significant number of people registered with the Independence party (3.3 percent) and the fact that a fifth of the borough is pledged to no party at all.
Since 2013—the year of the last citywide election—the number of Democrats has increased in every borough but Manhattan (which fell as registration in the borough declined generally) and the Democratic share of the active registered voter base has increased everywhere but Staten Island, where it dropped slightly.
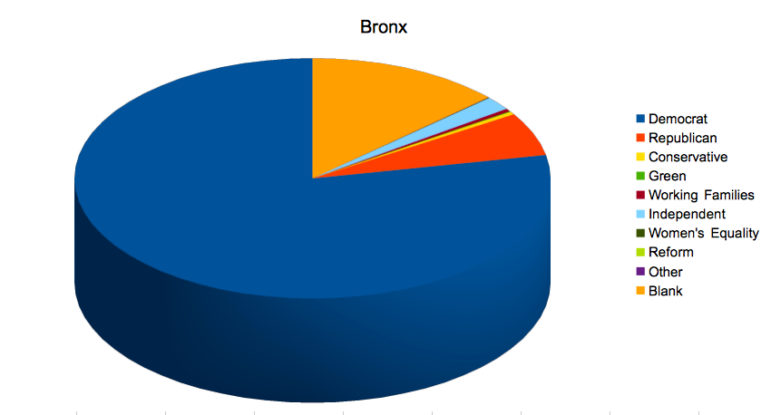
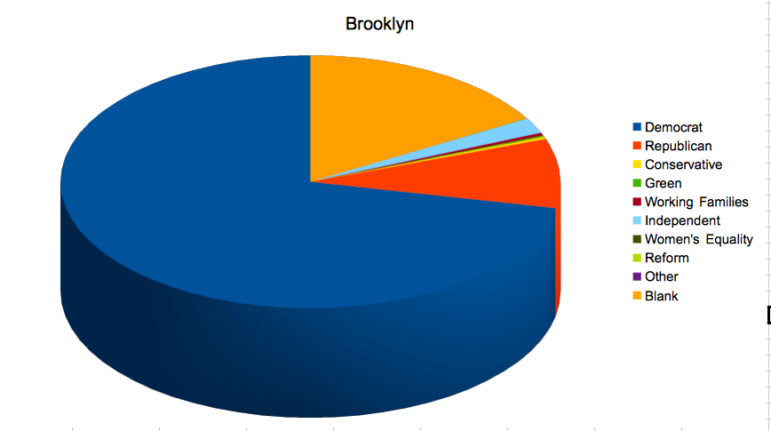
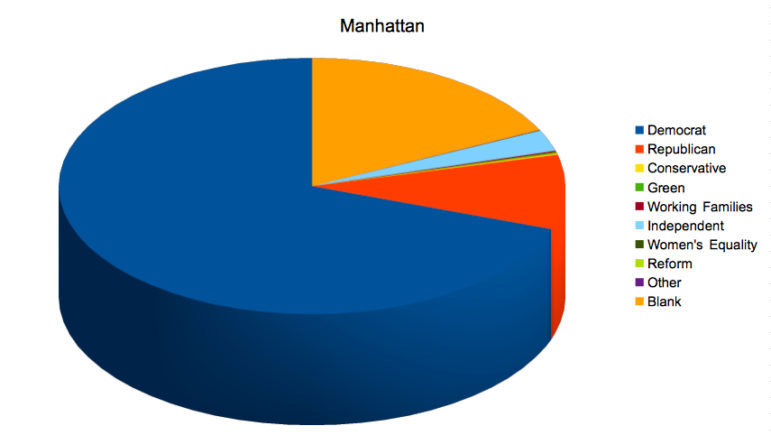
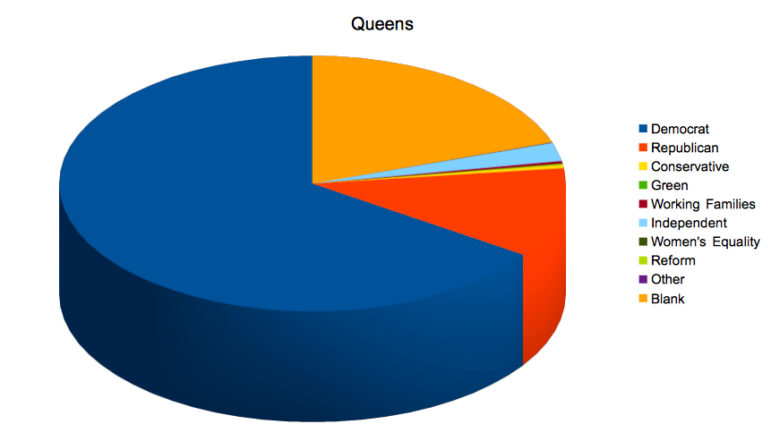
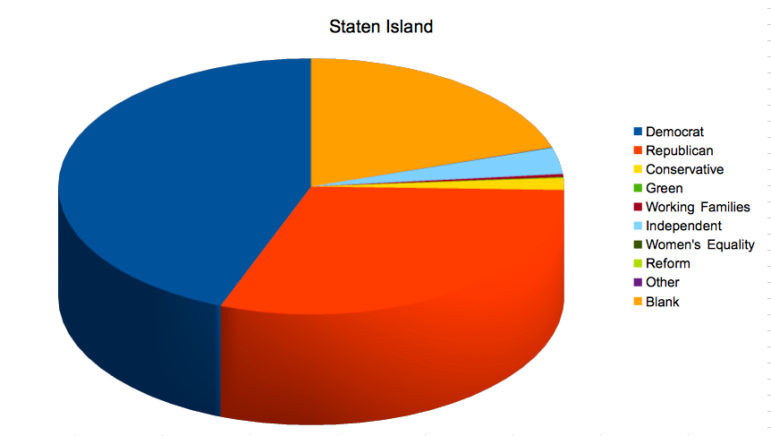
| Bronx | Brooklyn | Manhattan | Queens | Staten Island | ||
| Active registered voters as of April 2017 | Democrat | 540,542 | 1,010,433 | 681,447 | 743,473 | 124,461 |
| Republican | 40,328 | 124,407 | 91,646 | 128,178 | 85,636 | |
| Conservative | 2,753 | 4,321 | 1,594 | 5,103 | 4,221 | |
| Green | 720 | 2,806 | 1,907 | 1,781 | 388 | |
| Working Families | 2,547 | 4,771 | 1,718 | 3,171 | 1,046 | |
| Independent | 12,946 | 28,198 | 26,237 | 26,812 | 9,392 | |
| Women’s Equality | 311 | 403 | 266 | 363 | 71 | |
| Reform | 28 | 40 | 51 | 42 | 22 | |
| Other | 86 | 388 | 461 | 270 | 104 | |
| Blank | 91,643 | 234,248 | 173,949 | 223,951 | 56,435 | |
| Total | 691,904 | 1,410,015 | 979,276 | 1,133,144 | 281,776 | |
| Share of active registered voter pool as of April 2017 | Democrat | 78.12% | 71.66% | 69.59% | 65.61% | 44.17% |
| Republican | 5.83% | 8.82% | 9.36% | 11.31% | 30.39% | |
| Conservative | 0.40% | 0.31% | 0.16% | 0.45% | 1.50% | |
| Green | 0.10% | 0.20% | 0.19% | 0.16% | 0.14% | |
| Working Families | 0.37% | 0.34% | 0.18% | 0.28% | 0.37% | |
| Independent | 1.87% | 2.00% | 2.68% | 2.37% | 3.33% | |
| Women’s Equality | 0.04% | 0.03% | 0.03% | 0.03% | 0.03% | |
| Reform | 0.00% | 0.00% | 0.01% | 0.00% | 0.01% | |
| Other | 0.01% | 0.03% | 0.05% | 0.02% | 0.04% | |
| Blank | 13.25% | 16.61% | 17.76% | 19.76% | 20.03% |






One thought on “Data Drop: Which is the Bluest Borough?”
Dem registration higher than Rep registration due to many Islanders not bothering to change registration from D to R when moving to the island, but they vote republican as in 2016 –
https://files.acrobat.com/a/preview/1ed97ede-c309-4d54-8905-94f3e13d6a40