
Daniel Kay Hertz
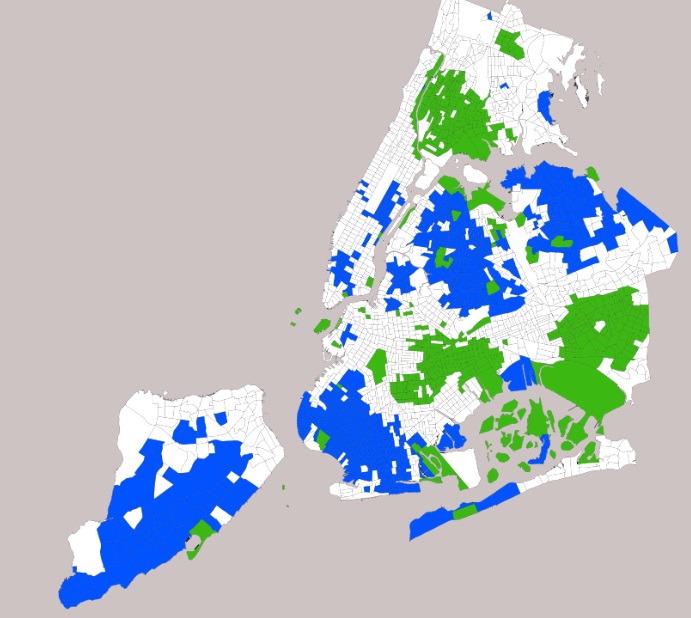
This map by scholar Daniel Kay Hertz depicts areas of the city where less than 2 percent of the population is white (green) or black (blue).
* * *
A cascade of crises is forcing America to confront the racism of its past and present—from overt acts of hate to subtler injustices that shape our society. Over 16 weeks, City Limits and Enterprise Community Partners will feature prominent New Yorkers’ views on how race and housing policy intersect to create a legacy each of us must confront, and the way forward we should take together. These are not necessarily views we endorse. But they are views we fully believe are important to share with each other. Here is the fifth post in our series. Read the rest here.
* * *
As New Yorkers, we often take pride in living in a highly diverse and inclusive city. Yet, while the city is indeed remarkably diverse with respect to race, ethnicity, and country of origin, our neighborhoods remain highly segregated by race.
Between 1980 and 2010, the average Black-White dissimilarity index (the most common measure of segregation) in metropolitan areas around the country fell from 73.1 to 59.4. During this same time period, segregation remained virtually unchanged in New York. In New York City, the Black-White dissimilarity index remained at 81.6 in 2010, meaning that 82.5 percent of White or Black New Yorkers would have to move to a different neighborhood in order for Blacks and Whites to be equally distributed across neighborhoods. Hispanic and Asian segregation have similarly remained unchanged since 1980, with the Hispanic-White dissimilarity index hovering between 64 and 67 and the Asian-White dissimilarity index staying between 49 and 51.
It’s worth noting that the dissimilarity index (and other measures that rely on census tracts) may overstate the degree of segregation in New York City relative to other cities because of the city’s greater residential density. The dissimilarity index measures the degree to which different racial groups live in different census tracts, statistical neighborhoods created by the U.S. Census Bureau, which house about 4,000 people on average. The typical census tract in the United States covers about two square miles. In New York, the typical census tract covers less than a tenth of a square mile. As a result, the dissimilarity index treats New Yorkers who live in very close proximity as living in different neighborhoods.
![]()
But even though one might take issue with New York’s ranking relative to other cities, there is no question that segregation, or at least Black-White segregation, has remained more persistent in New York City. A complex brew of factors contribute to contemporary segregation, including housing market discrimination, racial differences in income and wealth, differences in information and search patterns, and race-based neighborhood stereotypes (Ellen 2000). The NYU Furman Center’s Dream Revisited series highlights several debates about the causes of persistent segregation. But whether sustained primarily by explicit discrimination, implicit bias, differences in wealth, or other factors, segregation continues to have serious consequences.
To be clear, ethnic concentration is not inherently harmful, but segregation can affect individual outcomes by constraining residential options and shaping the resources and services available in the neighborhoods in which different groups live. In New York City, as well as most cities in the United States, segregation has resulted in members of different racial groups having access to dramatically different neighborhoods.
Consider neighborhood poverty rates: in 2010, the typical Hispanic New Yorker lived in a neighborhood (proxied by census tracts) with a poverty rate of 27 percent, and the typical Black New Yorker lived in a neighborhood with a poverty rate of 24 percent. While these rates have fallen since 1980 (when the typical Black New Yorker and the typical Hispanic New Yorker both lived in a neighborhood with a poverty rate of 30 percent), they are still much higher than the poverty rate of neighborhoods where Asian and White New Yorkers live. In 2010, the typical Asian and White New Yorkers lived in neighborhoods with 18 and 14 percent poverty rates respectively.
Disparities also emerge across neighborhoods when examining exposure to college-educated adults. The typical Black and Hispanic New Yorkers both lived in neighborhoods in 2010 in which 24 percent of adults had college degrees. The typical Asian New Yorker lived in a neighborhood in which 35 percent of adults were college graduates. Meanwhile, 47 percent of the adult neighbors of the typical White New Yorker were college graduates.
Neighborhood differences are not constrained to differences in resident demographics and income. The neighborhoods where different groups live also have very different levels of safety. The typical Black New Yorker lived in a neighborhood with an average of 7.1 violent crimes per 1,000 residents per year between 2010 and 2014, while the typical Hispanic New Yorker lived in a neighborhood with an average of 5.9 violent crimes per 1,000 residents. In sharp contrast, the average rates for the typical Asian and White New Yorkers were 3.4 and 2.7 violent crimes per 1,000 residents between 2010 and 2014, or roughly half the violence rates faced by their Black and Hispanic counterparts.
As for schools, segregation has also meant that Black and Hispanic children live near lower-performing schools. The typical White child and the typical Asian child live near elementary schools in which over half of children score at proficient levels on statewide math tests in 2014. Black and Hispanic children, by contrast, lived near schools in which only 27 percent and 34 percent of children scored proficient, respectively. To be sure, test scores are not a complete or ideal measure of school quality, but they are widely used by researchers as a rough proxy for school performance.
While the concentration of Black and Hispanic households in relatively disadvantaged communities may affect those households in a range of ways, there is particularly strong and persuasive research demonstrating that disadvantaged neighborhood environments undermine the long-run outcomes of children. The Moving to Opportunity Program Demonstration Program, which provided housing vouchers to a randomly chosen set of families living in high-poverty public housing developments to help them move to lower-poverty neighborhoods, is perhaps the strongest evidence yet showing that neighborhood disadvantage matters and shapes the long-run earnings of children. One study (Chetty et al., 2016) found that young children whose families were given vouchers to move to lower-poverty neighborhoods were more likely to attend college and enjoyed 31 percent higher earnings than the children of families who were not given vouchers. The researchers estimate that the children in the families that received vouchers when they were young will earn $302,000 more over the course of their lives relative to those whose families were not awarded a voucher.
One likely reason that the children moving to low-poverty neighborhoods fared better in the longer run is that these moves enabled them to grow up in neighborhoods with safer streets and better schools. There is mounting evidence that exposure to violence is highly detrimental to children. One study (Sharkey et al., 2015) found that children in New York City exposed to violence on their blockfaces the week before a standardized test perform worse on those tests compared to other similar children who live in blockfaces where violent crimes occur a week after the test. (A blockface is both sides of the street along a single street segment.)
Given the growing body of research showing that neighborhoods matter in shaping the life outcomes and well-being of children, the wide racial disparities we see in New York City in access to neighborhood resources and conditions are distressing. Segregation is clearly not creating separate but equal communities. Segregation has a long history in the city, and its causes are complex, but contemporary policies can make a difference. The Dream Revisited series highlights several debates about the causes of persistent segregation and how current policies—from Small Area Fair Market Rents to community preferences—can shape patterns of segregation.
Solutions to neighborhood segregation are not easy, especially given New York’s high-cost housing market. Yet, if we want our diverse city to be an equitable one as well, we must find ways to address the city’s persistent racial segregation and the disparities in neighborhood environment that accompany it.
* * *
Ingrid Gould Ellen is the Faculty Director of the NYU Furman Center, which provides research and debate on housing, neighborhoods, and urban policy, and the Paulette Goddard Professor of Urban Policy and Planning at NYU’s Robert F. Wagner Graduate School of Public Service.

One thought on “Building Justice: New York City’s Separate and Unequal Neighborhoods”
NYC has always had ethnic/racial neighborhoods. But the sad fact remains that over the last 50 years any neighborhood that becomes African-American also becomes a high-crime area. East New York, Flatbush, East Flatbush, Canarsie.