NYU Furman Center, Poverty in New York City report
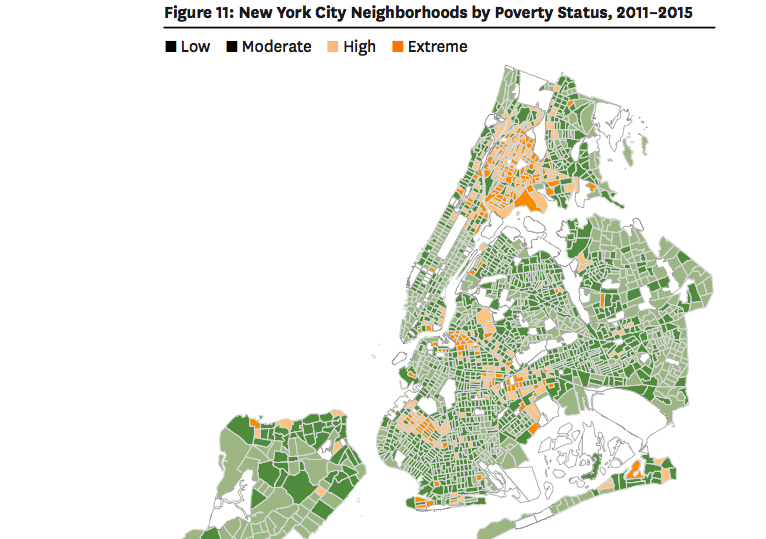
A map of New York City neighborhoods by poverty status based on American Community Survey data.
Crime is plummeting, the population is rising, and rents continue to climb. Yet despite these indicators that the city is in good economic health, New York City’s poverty rate has reversed its earlier decline and has nearly returned to year 2000 levels, according to a report by the Furman Center released Wednesday. Poverty concentration—a measure of the number of low-income New Yorkers living in low-income neighborhoods—has also reversed its earlier progress.
In many of the neighborhoods targeted by the de Blasio administration for a rezoning, rising levels of rent are occurring simultaneous to increases in poverty in certain census tracts—creating a complicated picture, where the threats of gentrification are felt equally alongside the pains of deprivation.
According to the report, released in conjunction with the 2016 State of New York City Housing and Neighborhoods Report, in the 2011-2015 span, 20.6 percent of New Yorkers lived in poverty—up from 2006-2010, when 19.1 percent of New Yorkers were considered impoverished. A family of two adults and two children is considered below the poverty line if their annual income is less than $24,036.
In addition, while the share of poor families segregated in extreme-poverty census tracts (where more than 40 percent of residents are below the poverty line) fell from 25.4 percent in 2000 to 19.4 percent in 2006-2010, it rose again to 23.5 percent in 2011-2015. Higher poverty census tracts tend to have more violent crime, lower school performance, worse housing and other problems that can be harmful to residents, according to the report.
And poverty concentration is worse in certain racial groups. Roughly 28 percent of Black and Latino poor people live in extremely poor census tracts, while only 18 percent of white poor people live in extremely poor census tracts and only 8.6 percent of poor Asians. That means that if you’re white or Asian and poor, your opportunities to get ahead may be much better that someone of the same income bracket and a different race, just based on the kind of amenities your neighborhood offers.
Many of the neighborhood rezonings proposed by the de Blasio administration overlap with extreme-poverty or high-poverty (30-40 percent poverty rate) census tracts, including East New York, Bushwick, Far Rockaway, parts of Long Island City, the Lower East Side, East Harlem, Inwood, and most of the west and southern Bronx. This is no surprise, given that the de Blasio administration has tended to target areas with a history of disinvestment for rezonings.
Of course, there are also high and extreme poverty census tracts in places that are not being targeted for a neighborhood rezoning by de Blasio, including Brownsville, Borough Park and the East Bronx, among other places. Brownsville will, however, receive over $150 million in investments and over 2,500 new rent-restricted homes under a plan released last week by the Department of Housing, Preservation and Development.
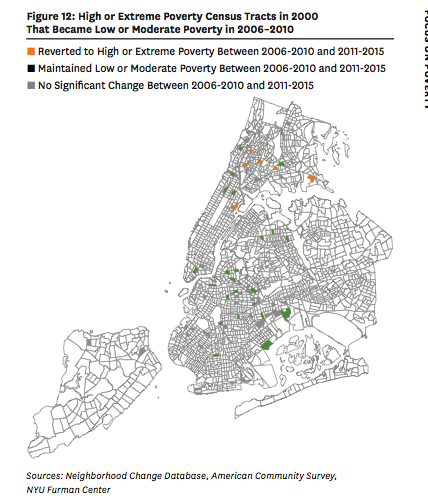
Another map in the report shows where poverty has worsened after temporarily declining to low or moderate levels—namely in parts of the east Bronx as well as two proposed rezoning areas: East Harlem and the Western Bronx.
NYU Furman Center
Some neighborhoods are becoming poorer at the same time as they are becoming hot destinations—a tale of two cities within one community district.
Take, for instance, East Harlem. On the one hand, the poverty rate is now slightly higher than it was in 2000, up from 37.1 to 37.5 percent. At the same time, since 2000 the share of residents making above $100,000 has increased by over four percent and the number of white residents has increased by nearly six percent. Meanwhile, there’s been a 4.5 percent decrease in Latinos and a 4.6 percent decrease in Black residents. And rents are rising, fast—in just the last year, median asking rents increased $120 from 2015 to 2016 (higher than the citywide rent increase of $50).
Other potentially rezoning community districts where rents are growing that saw increases in their poverty rates since 2000 include the Lower East Side, Flushing, and Bay Street. The poverty rate is also down from 2000, but up from 2010 in some parts of the Jerome Avenue area (Bronx Community District 4), Bushwick, and Inwood.
The report does not explain why the city has seen an increase in concentrated poverty or specify what kinds of investments can help reverse the trend, but at an event hosted by the Furman Center on Wednesday, panelists discussed what kind of strategies should, and should not, be brought to bear. A couple panelists noted that while gentrification may reduce poverty concentration, it also comes with dangers for the existing low-income population in a neighborhood.
“We need to be thinking about anti-displacement measures,” said Jennifer Jones Austin, executive director of the Federation of Protestant Welfare Agencies. “Let’s not just think about flipping communities or sending people of low-income into higher-income communities. Let’s think about how they can take advantage of the gentrification that is occurring in the communities that they’ve been loyal to for significant periods of time.”
Of course, it could be further debated whether you need an influx of high-income people, or just an influx of resources, to improve the conditions of a poor neighborhood. When it comes to investing resources in poor communities, Jacob Faber, an assistant professor at NYU Wagner, says the city could be doing better.
“New York City has the second highest GDP of all cities in the world. So, I think when we’re talking about investing in poor communities it’s important to acknowledge that we can afford a lot more, but we’re choosing not to,” he said.
Here are a few more facts about the community districts where one of 12 rezonings has been completed or contemplated (which we follow at Zonein.org) as gleaned from the 2016 State of New York City Neighborhoods Report.
1. Asking rents grew in all but one of the community districts from 2015 to 2016, and the Rockaways saw the largest increase among them. The asking rent in Park Slope/Gowanus/Carroll Gardens did not increase.
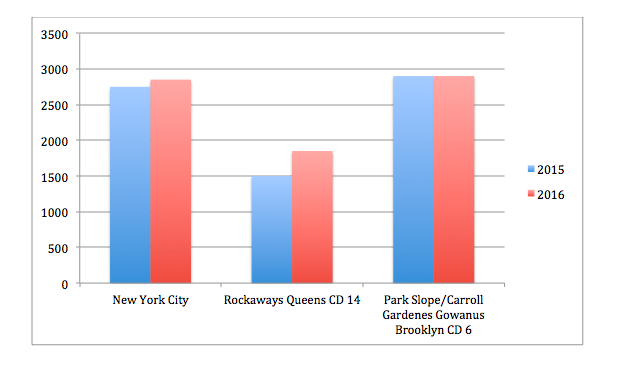
Change in Asking Rents for Two Potentially Rezoning Community Districts
Community districts covering parts of Jerome Avenue, parts of Southern Boulevard, and Bay Street also saw large increases.
These statistics suggest that already gentrified community districts like Park Slope/Carroll Gardens/Gowanus—at least the wealthier parts of that district—have already reached their peak in terms of rising rents, while the real-estate market in areas farther from the city core are heating rapidly, which could put those in extreme poverty at risk of homelessness or displacement.
2. Among the community districts we studied, Inwood and part of Long Island City (Queens Community District 1) tied for the largest increase in white residents from 2010-2014 to 2011-2015, while the Rockaways saw the largest decrease, with Flushing and Bay Street close seconds.
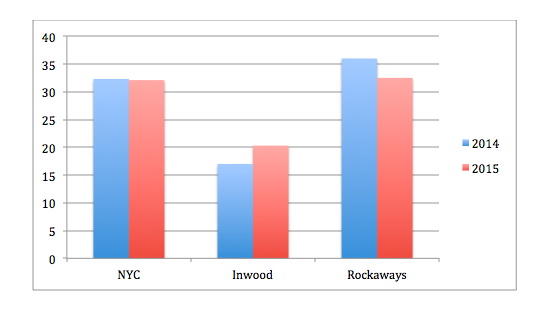
Change in Percent of Population That is White in Two Potentially Rezoning Community Districts
Increases in white residents in Inwood and Long Island City were accompanied by decreases in Black and Latino residents. The Rockaways, Bay Street and Flushing are all experiencing rent increases, but bucked the stereotypical trend, with the share of population that is white shrinking by about 3.5 percent.
3. In all but one community district, there was an increase in the number of residents with a bachelor’s degree from 2010-2014 to 2011-2015. East Harlem had the largest increase, while part of Jerome Avenue (Bronx Community District 4) had no increase.
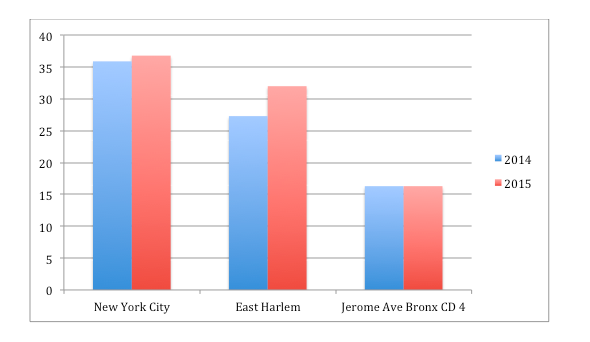
Change in Percent of Population That Has A Bachelor’s Degree in Two Potentially Rezoning Community Districts





6 thoughts on “Report: Rents Rose, But So Did Poverty”
Population increase causes rent to increase, and poverty to increase. Pretty basic.
Agree with you on population, but why would poverty increase at same time? Rents up in all 5 boroughs, even on Staten Island –
https://files.acrobat.com/a/preview/ee9b2c90-3aeb-4bde-bfe1-7adfeedbd9ec
Hello! The more rent you pay the less money in your pocket. Utilities n cable are outta control too. You work nowadays to live. People have to bunch up in apartments to pay that dam rent.
The PERCENTAGE of the population in poverty should not increase just because the population has grown. Poverty is expanding exponentially because incomes in the bottom two-thirds of our society have remained essentially flat over the past 30 years (adjusted for inflation)—while the household costs that are considered “normal” living expenses have almost tripled during the same period. Unfortunately, the “official” poverty benchmark maintained by the federal government has not been effectively adjusted in more than 50 years. Therefore, many families who were actually descending slowly into poverty over the past two generations, didn’t realize they had a problem; and many continue to believe they’re not affected. Often, they only realize what’s happening when they suddenly need Medicaid to cover the costs of an elderly parent’s care. That’s when the realization hits: “Oh yeah, Medicaid is a program designed for the poor. Why do WE need it to take care of Mom?” Today, we can project that 88% of all American adults now alive either already need Medicaid to cover their care, or will need it when, as seniors, their savings no longer cover the cost of their chronic conditions… If Medicaid doesn’t get terminated before they get there! The bottom line is simple: If the work you do throughout your productive life cannot provide for you and your kids, take care of you until you die, and allow you to leave a better foundation for your offspring than you got from your parents, you’re sliding into poverty. You’re getting poor. People, need to wake up: Poverty is eating away into higher and higher brackets of our society at an alarming rate. Poverty is not a “state of mind”—and you cannot pay your housing costs with optimism.
Very well said
Pingback: That night the lights went out | Intrepid Report.com