
Adi Talwar
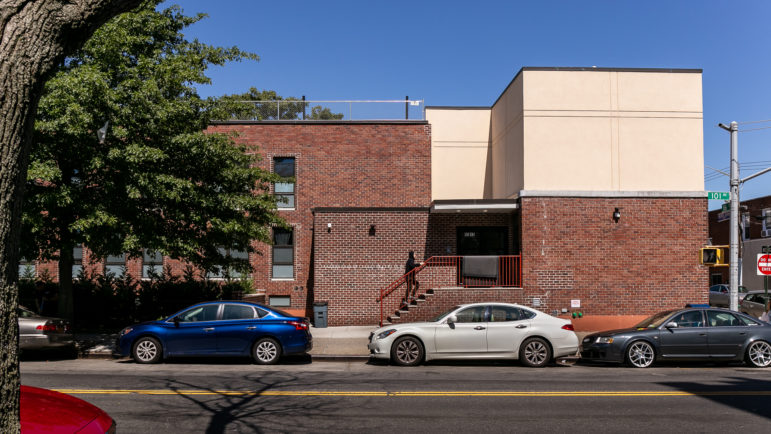
The city faced stiff opposition from residents of Ozone Park when it first announced it’s plans for placing a homeless shelter for men at this location.
Mayor de Blasio’s plan to build 90 new homeless shelters around the city has encountered fierce opposition in several neighborhoods. As City Limits reported Monday, opponents in different communities cite various reasons for resisting new shelters. Some cite public safety fears, concerns about strain on local services, worries about the safety or suitability of the proposed site for shelter residents, or fears about the impact a shelter might have on other plans for the neighborhood.
A constant theme in the conversation is “fair share” — i.e., whether neighborhoods are being asked to shoulder more of the burden than is fair. Fair share is a formal part of the city charter, but it’s also an idea. And it’s a more complex idea that it sounds. Does “fair share” refer only to a particular type of infrastructure, or to all types: If one community has three jails and another has one jail and four waste transfer stations, who is bearing the heavier share? Is it fair to communities to insist that they absorb more of the shelter system simply because their residents face harsher economic realities and are more likely to be homeless? And who deserves fairness more: shelter neighbors worried about quality of life or homeless people facing a housing crisis?
And of course, however one defines it, the question of fairness has to be dealt with amid the practicalities of finding space for new shelter beds and doing so with some urgency.
The questions are complex but some of the numbers below, courtesy of the Department of Homeless Services as of July 31, are not: There are nine districts in the city that do not host a single shelter bed.
| Community district | Neighborhoods | Individuals in the shelter system who come from the district | Individuals sheltered in the district | Share of total shelter population that comes from the district | Share of citywide total shelter population hosted in the district |
| Bronx 1 | Mott Haven / Melrose | 2,012 | 1,910 | 4.5% | 3.3% |
| Bronx 2 | Hunts Point / Longwood | 1,058 | 1,228 | 2.4% | 2.1% |
| Bronx 3 | Morrisania / Crotona | 1,960 | 2,557 | 4.4% | 4.4% |
| Bronx 4 | Highbridge / Concourse | 2,297 | 3,733 | 5.1% | 6.4% |
| Bronx 5 | Fordham / University Heights | 2,081 | 2,731 | 4.6% | 4.7% |
| Bronx 6 | Belmont / East Tremont | 1,621 | 2,869 | 3.6% | 4.9% |
| Bronx 7 | Kingsbridge Heights / Bedford | 1,330 | 1,275 | 3.0% | 2.2% |
| Bronx 8 | Riverdale / Fieldston | 328 | 248 | 0.7% | 0.4% |
| Bronx 9 | Parkchester / Soundview | 1,895 | 826 | 4.2% | 1.4% |
| Bronx 10 | Throgs Neck / Co-op City | 508 | 584 | 1.1% | 1.0% |
| Bronx 11 | Morris Park / Bronxdale | 817 | 0 | 1.8% | 0.0% |
| Bronx 12 | Williamsbridge / Baychester | 1,870 | 388 | 4.2% | 0.7% |
| Brooklyn 1 | Greenpoint / Williamsburg | 447 | 890 | 1.0% | 1.5% |
| Brooklyn 2 | Fort Green / Brooklyn Heights | 415 | 635 | 0.9% | 1.1% |
| Brooklyn 3 | Bedford Stuyvesant | 1,752 | 1,671 | 3.9% | 2.9% |
| Brooklyn 4 | Bushwick | 696 | 1,485 | 1.6% | 2.5% |
| Brooklyn 5 | East New York / Starrett City | 2,631 | 2,226 | 5.9% | 3.8% |
| Brooklyn 6 | Park Slope / Carroll Gardens | 274 | 526 | 0.6% | 0.9% |
| Brooklyn 7 | Sunset Park | 255 | 802 | 0.6% | 1.4% |
| Brooklyn 8 | Crown Heights / Prospect Heights | 819 | 1,069 | 1.8% | 1.8% |
| Brooklyn 9 | S. Crown Heights / Lefferts Gardens | 616 | 778 | 1.4% | 1.3% |
| Brooklyn 10 | Bay Ridge / Dyker Heights | 114 | 0 | 0.3% | 0.0% |
| Brooklyn 11 | Bensonhurst | 207 | 0 | 0.5% | 0.0% |
| Brooklyn 12 | Borough Park | 130 | 137 | 0.3% | 0.2% |
| Brooklyn 13 | Coney Island | 407 | 130 | 0.9% | 0.2% |
| Brooklyn 14 | Flatbush / Midwood | 584 | 100 | 1.3% | 0.2% |
| Brooklyn 15 | Sheepshead Bay | 161 | 212 | 0.4% | 0.4% |
| Brooklyn 16 | Brownsville | 1,557 | 3,671 | 3.5% | 6.3% |
| Brooklyn 17 | East Flatbush | 1,306 | 1,018 | 2.9% | 1.7% |
| Brooklyn 18 | Flatlands / Canarsie | 770 | 1,214 | 1.7% | 2.1% |
| Manhattan 1 | Financial District | 467 | 140 | 1.0% | 0.2% |
| Manhattan 2 | Greenwich Village / Soho | 43 | 0 | 0.1% | 0.0% |
| Manhattan 3 | Lower East Side / Chinatown | 579 | 1,666 | 1.3% | 2.9% |
| Manhattan 4 | Clinton / Chelsea | 317 | 1,121 | 0.7% | 1.9% |
| Manhattan 5 | Midtown | 127 | 2,524 | 0.3% | 4.3% |
| Manhattan 6 | Stuyvesant Town / Turtle Bay | 125 | 851 | 0.3% | 1.5% |
| Manhattan 7 | Upper West Side | 305 | 1,107 | 0.7% | 1.9% |
| Manhattan 8 | Upper East Side | 130 | 80 | 0.3% | 0.1% |
| Manhattan 9 | Morningside Heights / Hamilton | 674 | 862 | 1.5% | 1.5% |
| Manhattan 10 | Central Harlem | 1,418 | 1,821 | 3.2% | 3.1% |
| Manhattan 11 | East Harlem | 1,444 | 2,275 | 3.2% | 3.9% |
| Manhattan 12 | Washington Heights / Inwood | 709 | 402 | 1.6% | 0.7% |
| Queens 1 | Astoria | 722 | 784 | 1.6% | 1.3% |
| Queens 2 | Woodside / Sunnyside | 378 | 1,069 | 0.8% | 1.8% |
| Queens 3 | Jackson Heights | 275 | 954 | 0.6% | 1.6% |
| Queens 4 | Elmhurst / Corona | 211 | 638 | 0.5% | 1.1% |
| Queens 5 | Ridgewood / Maspeth | 242 | 0 | 0.5% | 0.0% |
| Queens 6 | Rego Park / Forest Hills | 55 | 0 | 0.1% | 0.0% |
| Queens 7 | Flushing / Whitestone | 223 | 230 | 0.5% | 0.4% |
| Queens 8 | Hillcrest / Fresh Meadows | 302 | 311 | 0.7% | 0.5% |
| Queens 9 | Kew Gardens / Woodhaven | 309 | 103 | 0.7% | 0.2% |
| Queens 10 | S. Ozone Park / Howard Beach | 273 | 968 | 0.6% | 1.7% |
| Queens 11 | Bayside / Little Neck | 29 | 0 | 0.1% | 0.0% |
| Queens 12 | Jamaica / Hollis | 1,697 | 3,177 | 3.8% | 5.4% |
| Queens 13 | Queens Village | 623 | 1,632 | 1.4% | 2.8% |
| Queens 14 | Rockaway / Broad Channel | 1,070 | 625 | 2.4% | 1.1% |
| Staten Island 1 | St. George / Stapleton | 947 | 149 | 2.1% | 0.3% |
| Staten Island 2 | South Beach / Willowbrook | 85 | 0 | 0.2% | 0.0% |
| Staten Island 3 | Tottenville / Great Kills | 58 | 0 | 0.1% | 0.0% |
| TOTAL | 44,755 | 58,402 |
It’s worth noting that not every homeless person can be traced to a home community board. Prior addresses for 9,600 shelter residents can be linked to a borough but not a community district, so those people are not accounted for in the first column. Neither are 3,600 people who did not have a previous New York City address and 443 for whom no previous address information exists.
Looking at borough totals, the Bronx and Staten Island host less than their share of the homeless population, Queens and Manhattan host slightly more and Brooklyn is roughly proportionate.
| Borough | Individuals sheltered in the borough | Individuals in the shelter system who come from the borough |
| Bronx | 31.42% | 38.34% |
| Brooklyn | 28.36% | 28.63% |
| Manhattan | 22.00% | 16.67% |
| Queens | 17.96% | 15.33% |
| Staten Island | 0.26% | 2.37% |

6 thoughts on “Data Drop: Which NYC Neighborhoods Host the Most Homeless-Shelter Beds?”
Pingback: 399 3rd Avenue Shelter FAQ - Brad Lander
Thank you, Jarrett. DHS would only lie and obfuscate when asked.
Question, why does Manhattan have so many Homeless people?
Answer, they are being used to subsidize the hotel system while there are no tourists coming to NYC.
Question, what is NYC paying to house the homeless in the Manhattan hotels?
Answer, top dollar, no discounts like tourist may get.
Last question, how does a borough fourth in population have more homeless than the three much more populated boroughs?
Answer, by being dumped on by the de Blasio administration for 8 years. Send them to the Bronx. The intake center is in the Bronx, as are two hospitals where most single adults are taken.
Uh except that data is from July 2019…
Emergency
What do you do when you’re desperately trying to find housing after being in a shelter for 5 years, but the housing office keeps sabotaging you at every turn, and there’s literally no one coming to your rescue to help you out? Day in and day out looking for and finding apartments, gathering your stuff to get out when you find something, but the housing folks at your shelter keep throwing a monkey wrench causing you to lose the apartments, and no one on the outside will take you serious so you can get out? PLEASE HELP ME?
I had a case worker who fast tracked me to a program where I was gonna get a apartment, and when Dhs found out they fired him thats who these people are if u ain’t helping yourself they could care less, to many egos and attitudes with these city workers they are super disrespectful until they absolutely know u gonna take a charge and put blood in they mouth. These are the worst people to deal with when u already got issues