
Daniel Case, Youngking11
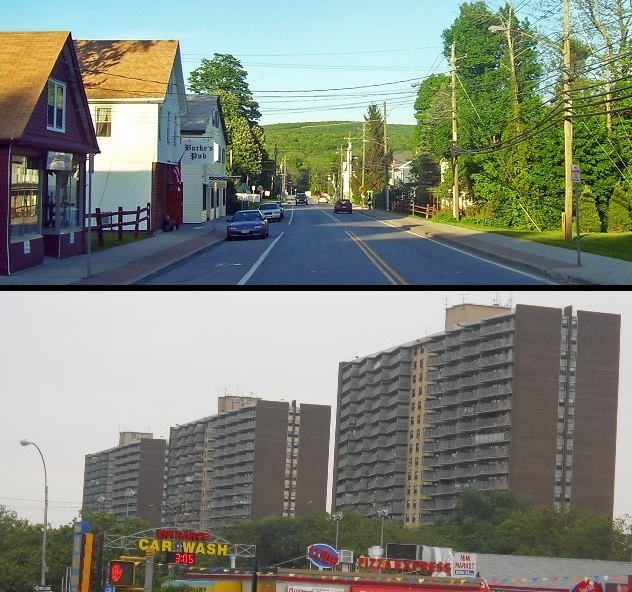
It is a 100-mile, two-hour drive from the southern tip of Staten Island to the northeastern corner of Putnam County—a journey that covers a vast swath of downstate New York and takes you to a town called Patterson that boasts 12,000 people and a ski area called Thunder Ridge.
Thunder Ridge might feel a long way from Jerome Avenue in the Bronx or East New York in Brooklyn. But that area is part of the weird math that helps determine how affordable the apartments in the city’s affordable housing plan really are. That’s because Putnam County is, along with Westchester and Rockland counties, part of the territory for which New York City’s Area Median Income, or AMI, is calculated.
Anyone who’s read a story about affordable housing in New York City probably knows that AMI is how the city characterizes eligibility for subsidized housing. A development might offer apartments for households making up to 60 percent of AMI, which means $46,620 for a three-person household, or 80 percent of AMI, equal to $69,040 for a family of four.
By some measures, the AMI that New York City uses is 20 percent higher than actual median incomes in the city. That’s not surprising when you consider that median income in the Bronx in 2014 was just under $32,300, while in Putnam it was $96,000.
Some have called for changing the way AMI is calculated. Congressman Jose Serrano wrote in December to U.S. Department of Housing and Urban Development Secretary Julian Castro to ask that HUD “assess the impact of more accurate AMI measurements in New York City.”
Others contend that a higher or lower AMI won’t change the hard math of housing costs in New York City. The real mismatch, they say, is between the increasing cost of building and maintaining housing and the stagnant incomes of many New Yorkers.
One thing is certain: AMI is a pretty odd number to play as big a role as it does in how we talk about affordable housing.
Carve-outs for counties
Area median incomes became a part of housing policy in the federal Housing Act of 1937, also known as the Wagner-Steagall Act, a critical piece of New Deal legislation that among other things basically created public housing. Even then, battle lines were drawn over income levels. Private interests didn’t want public housing to compete with market-rate stuff, so Congress set very low income-eligibility levels.
Over subsequent decades, AMI was used in a few other federal housing initiatives but its big moment came in 1986 when, as part of a sweeping overhaul of tax rules, Congress created Low Income Housing Tax Credits. These credits allow builders to wipe away a piece of their federal tax liability based on the construction cost for housing set aside for households making up to 60 percent of AMI. Tax credits, which can be sold to third parties through a secondary market, are a huge driver of affordable housing construction in New York and elsewhere.
The “area” in “area median income” has typically been the Metropolitan Statistical Areas created by the U.S. Office of Management and Budget for use by a range of government programs. MSAs are supposed to be based on commuting patterns.
But New York’s AMI region has long been treated differently.
In 1990, a burst of homelessness in Westchester County was blamed on the fact that AMIs were too low there. The rent paid by the households who qualified for affordable housing in Westchester wasn’t enough to cover operating costs, so—the story goes—developers there stopped building. In essence, New York City income data was dragging Westchester AMIs down, to the county’s detriment. So, Rep. Nita Lowey amended the 1990 Cranston-Gonzalez Affordable Housing Act to carve Westchester into its own area. That meant that AMI for the county was based on actual incomes there.
In 1998, Rep. Benjamin Gilman did the same for Rockland County by amending the Quality Housing and Work Responsibility Act of 1998. So Rockland also now has its own AMI. (Lowey didn’t reply to a request for comment and Gilman couldn’t be reached. His role was confirmed by former Rep. Rick Lazio, who was then chairman of the House Banking Subcommittee on Housing and Community Opportunity.)
Crucially, however, the same legal language that gives Rockland and Westchester Counties their own AMIs requires that New York City’s AMI still include data from those counties. In other words, New York City data no longer drags Westchester and Rockland AMIs down, but their data still yanks NYC’s AMI up.
Feds’ methods evolve
In 2003, OMB expanded the Metropolitan Statistical Areas to reflect new, longer commuting patterns. That made for AMIs that spanned too many different housing markets, so in several dozen cases HUD created smaller regions called HMFAs (HUD Metro Fair-market rent Areas). New York City, Putnam, Rockland and Westchester now compose an HMFA, and that’s where the AMI comes from.
It gets even messier, however: AMI in New York City doesn’t directly reflect Census data about incomes. Instead, it takes the actual income statistics and inflates them to account for unusually high housing expenses in the region. And the AMIs for different family sizes aren’t based on actual data, but on estimates of how income varies among households big and small.
HUD is experimenting with new ways of calculating the income limits and fair-market rents crucial to a number of its programs. Charles McNally, a spokesman for HUD’s regional office, says there’s no formal mechanism for a city or county to challenge an AMI that seems out of step with reality; but he suggests that a complaint based on data might get the agency’s attention.
Serrano’s letter doesn’t explicitly call for changing the way New York City calculates AMI. Rather, it suggests that HUD explore what the impact of a change would be.
Would different numbers mean a different policy?
The impact of the AMI mismatch, critics have long said, is that the city ends up subsidizing housing that is unaffordable to the income groups facing the most severe housing crisis, and out of step with the communities in which the housing is built.
Those concerns were aired frequently during last week’s City Council hearing about Mayor de Blasio’s Mandatory Inclusionary Housing (MIH) proposal.
MIH would apply to areas that get rezoned. It would require any new construction to set aside a share of apartments for different income groups. For instance, the administration’s proposed Option 1 would mandate that a quarter of housing be affordable—meaning rents eat up no more than 30 percent of income—for families making on average 60 percent AMI.
Administration officials insist that lower-incomes would be served via MIH because the income target is an average: Some units could serve higher incomes, some lower. Forcing all developers to go lower, the city argues, could scare builders out of the marketplace. The city also worries that if zoning requirements are made too financially onerous, property owners could claim that the rules constitute an “illegal taking” and sue to dismantle the whole requirement.
Critics, however, contend that the city is underestimating what developers could afford.
An AMI that omits counties outside the city could at least make the affordable housing debate more transparent. But a lower AMI wouldn’t magically make it possible for the city to serve more low-income families, whether under MIH or through the subsidy programs that make up the rest of the mayor’s affordable-housing plan. Even an AMI based solely on the five boroughs would generate mismatches: Staten Island’s median income in 2014 was twice that of the Bronx.


7 thoughts on “The Secret History of AMI”
Pingback: The Secret History of AMI | Scott Andrew Hutchins
Pingback: Mapping New York City’s affordability gap - fmm
Pingback: Mapping New York City’s affordability gap | Real Estate Marketplace
Great informative publication
Pingback: How to apply for NYC’s affordable housing lottery | Real Estate Marketplace
Pingback: How to apply for NYC's affordable housing lottery | News for New Yorkers
Pingback: Affordable housing in New York: how to apply for affordable apartments - Curbed NY