Photo by: Karla Ann Cote
Love it or hate it, one could never accuse the New York State Lottery of failing to offer customers plenty of choices.
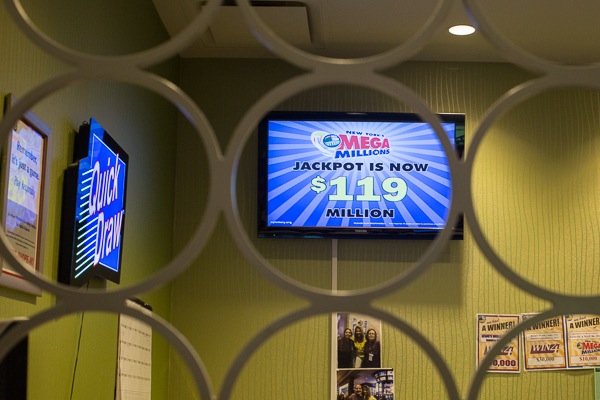
From scratch-off games to multi-state drawings, twice-weekly contests to Quick Draw running every four minutes, the lottery has a game for you regardless of whether you want to instant gratification or suspense, lust after a few thousand or multiple millions, have 10 lucky numbers or just three.
Much of lottery’s revenue goes to state government’s coffers. A substantial share pays vendors who make and market the games. But just under half the money generated by lottery players goes back to them—or, more accurately, transfers from one player to another—in the form of prizes.
After a Freedom of Information Request, City Limits obtained from the Division of Lottery data on sales by each lottery vendor around the state and the amount of smaller prizes ($600 or less) paid out by each location. We also obtained a breakdown of larger prizes (more than $600) by the ZIP code in which they were claimed.
By compiling the sales and winnings data by ZIP code—and tossing out codes that registered wagers but no winnings, which suggested that prizes were claimed elsewhere—we produced this clickable map of lottery play last year:
The top ten ZIP codes for lottery sales were all in New York City:
This is one of a series of articles on the past, present and future of gambling in New York State. Click here to read more. The Fund for Investigative Journalism’s generous support made this series possible.