In the 10 days since Arizona passed a law requiring police to stop people suspected of being illegal immigrants, the world has weighed in. The South China Morning Post reported on the “fierce political and legal row” that’s broken out over the law. Germany’s Die Zeit talked about Mexico warning travelers about going to Arizona. “A long legal battle is likely, possibly centering on a clause of the U.S. Constitution that protects citizens against unreasonably being stopped and searched,” read the Sydney Morning Herald.
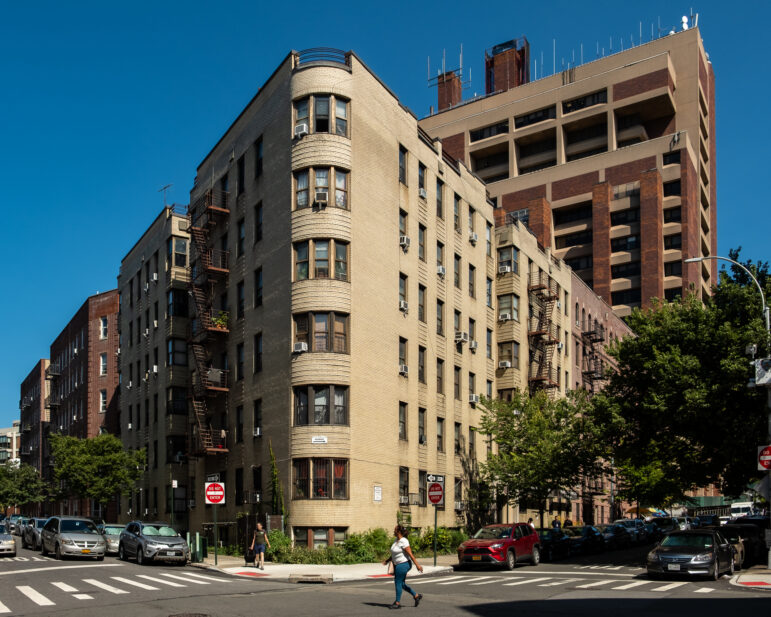
New York City is 2,100 miles from Phoenix but when it comes to the politics of immigration, the towns are light years apart, in no small part because legal immigrants—both permanent residents and citizens—and descendents of immigrants are too big a political force and too obvious an economic contributor.
Department of Homeland Security data show that as of Jan. 2008 some 12.6 million legal immigrants—people with permanent residency but not citizenship—were living in the United States. With 1.5 million, New York state ranked only behind California for number of legal immigrant residents. The New York City-Northern New Jersey-Long Island metropolitan area saw 180,000 new legal immigrants in 2008, more than any other metro area and more than 10 percent of the total intake nationwide. Meanwhile, the population of undocumented immigrants in Jan. 2009 is estimated by DHS to be 10.8 million nationwide, with about half a million in New York state.
The Census Bureau’s American Community Survey has this breakdown of where New Yorkers who reported a national origin (about half do) in 2006 through 2008 said they or their forebears came from:
Italian 596,478
Irish 305,772
American 228,905
Jamaican 218,097
Russian 209,955
Polish 169,700
German 158,359
Haitian 119,333
Guyanese 108,744
African 107,124
English 93,088
Greek 77,268
West Indian 73,425
Trinidadian and Tobagonian 73,206
European 66,329
Ukrainian 44,850
Eastern European 42,285
British West Indian 41,897
Hungarian 40,947
French (except Basque) 38,915
Albanian 35,038
Romanian 23,159
Scottish 22,832
Barbadian 22,427
Israeli 21,991
Nigerian 21,384
Ghanian 21,123
Austrian 20,048
Scotch-Irish 18,441
Egyptian 17,284
Other Subsaharan African 16,804
British 16,686
Turkish 15,081
Norwegian 14,203
Other Arab 13,688
Brazilian 13,388
Dutch 13,092
Arab 12,676
Yugoslavian 12,481
Swedish 11,652
Armenian 10,813
Portuguese 10,309
Lebanese 10,292
Croatian 10,152
Iranian 9,432
Czech 8,722
Moroccan 8,064
Afghan 7,975
Lithuanian 7,906
Syrian 7,867
Canadian 7,466
French Canadian 6,184
Serbian 5,436
Belizean 5,398
Swiss 5,358
Bulgarian 5,188
Welsh 5,009
Macedonian 4,835
Danish 4,671
Slovak 4,521
Czechoslovakian 4,205
Palestinian 4,039
Australian 3,726
Senegalese 3,246
Scandinavian 3,195
Maltese 3,136
Belgian 3,102
Northern European 2,979
Ethiopian 2,433
Latvian 2,274
Finnish 2,244
U.S. Virgin Islander 2,232
Liberian 2,176
Sierra Leonean 1,932
Slavic 1,858
Sudanese 1,657
South African 1,631
Jordanian 1,485
Estonian 1,208
Iraqi 1,131
Cypriot 1,100
Dutch West Indian 949
Slovene 911
Other West Indian 840
Icelander 759
Bahamian 741
Bermudan 645
Basque 586
Somalian 565
New Zealander 506
Cape Verdean 495
Celtic 481
Pennsylvania German 305
Soviet Union 297
Cajun 252
Kenyan 240
Assyrian/Chaldean/Syriac 160
Zimbabwean 158
Luxemburger 92
Carpatho Rusyn 86
Alsatian 85
German Russian 75
Ugandan 62