The president’s tax cut and tougher trade policies led to a brief rise in national manufacturing jobs numbers. New York didn’t benefit from the bump.

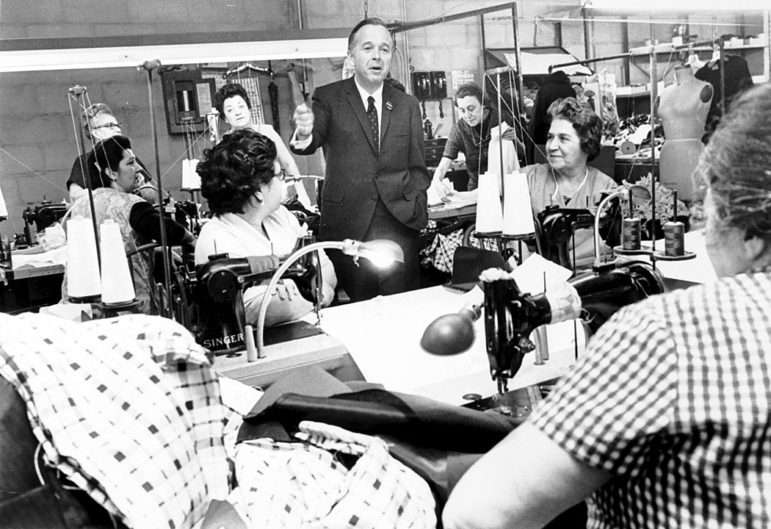
Kheel Center/International Ladies Garment Workers Union Photographs
A labor leader visits garment workers in a Brooklyn factory in 1968.Whether his presidency ends in three months or in four years, one of the few complicated aspects of President Trump’s legacy will be his impact on the economy.
The pandemic wiped out significant job gains during the first three years of Trump’s first term. Those gains followed a trend that began under President Obama, but they likely also reflected the president’s 2017 tax cut. That policy swelled the deficit and skewed benefits toward the rich, and we might never know what its long-term effect would have been, but it did provide a boost.
At the same time, the pandemic’s impact may have been heightened by the administration’s sloppy handling of the crisis—by resisting short-term measures to curb the virus, Trump might have increased its lasting economic impact. The president’s tendency to point to the stock market as an indicator of the success of his economic policies reflects some combination of political tone-deafness and misunderstanding the loose links between movements in the Dow Jones and the financial prospects of most Americans.
Given the narrative around Trump’s 2016 victory and the role white, working-class voters played in it, manufacturing is of particular importance to assessing his economic impact. As the New York Times reported this weekend, Trump deserves credit for changing the conversation around trade—challenging a bipartisan, centrist Washington consensus that the freer trade was, the better.
The national job numbers indicate manufacturing employment growth took off early in the Trump era before slowing in 2019, ahead of the COVID-19 slump.
Manufacturing is usually depicted as a Rust Belt story, for obvious reasons. But it’s part of New York City’s economic past and present as well—New York City was once a national center of manufacturing, with more than 1 million people employed in the sector in 1950, and the desire to encourage a rebirth of the sector has fueled innovative initiatives and fed discord over some of Mayor Bill de Blasio’s land-use plans.
So, how has New York City’s manufacturing base fared under Trump?
Numbers provided by the office of New York City Comptroller Scott Stringer indicate that the brief national bump in manufacturing employment was not felt here. Instead, a steady erosion of the sector continued. The only good news recently is that a sudden fall earlier in 2020—due, no doubt, to COVID-19—has been followed by a modest recovery. Detailed data follows the chart.
| Year and month | Total nonfarm jobs (thousands) | Total private-sector jobs (thousands) | Manufacturing jobs (thousands) |
| 1990M01 | 3,631.22 | 3,024.67 | 279.54 |
| 1990M02 | 3,626.25 | 3,019.33 | 277.14 |
| 1990M03 | 3,614.72 | 3,006.96 | 274.73 |
| 1990M04 | 3,597.47 | 2,988.80 | 269.55 |
| 1990M05 | 3,603.93 | 2,987.30 | 269.25 |
| 1990M06 | 3,593.98 | 2,977.34 | 267.18 |
| 1990M07 | 3,558.30 | 2,967.06 | 264.84 |
| 1990M08 | 3,571.98 | 2,968.04 | 262.80 |
| 1990M09 | 3,563.58 | 2,952.23 | 259.95 |
| 1990M10 | 3,528.07 | 2,921.42 | 256.29 |
| 1990M11 | 3,514.85 | 2,909.33 | 253.04 |
| 1990M12 | 3,502.28 | 2,898.71 | 251.76 |
| 1991M01 | 3,459.54 | 2,857.85 | 246.37 |
| 1991M02 | 3,445.07 | 2,844.46 | 245.11 |
| 1991M03 | 3,431.28 | 2,832.12 | 243.19 |
| 1991M04 | 3,411.51 | 2,812.21 | 240.09 |
| 1991M05 | 3,399.06 | 2,800.38 | 237.74 |
| 1991M06 | 3,396.72 | 2,798.43 | 237.27 |
| 1991M07 | 3,348.85 | 2,776.35 | 235.19 |
| 1991M08 | 3,354.17 | 2,769.95 | 235.61 |
| 1991M09 | 3,351.87 | 2,762.26 | 234.14 |
| 1991M10 | 3,347.88 | 2,758.10 | 235.10 |
| 1991M11 | 3,340.52 | 2,753.46 | 233.57 |
| 1991M12 | 3,323.77 | 2,739.67 | 232.17 |
| 1992M01 | 3,325.16 | 2,740.14 | 231.01 |
| 1992M02 | 3,312.07 | 2,728.14 | 229.32 |
| 1992M03 | 3,304.98 | 2,720.99 | 228.00 |
| 1992M04 | 3,304.77 | 2,720.29 | 228.76 |
| 1992M05 | 3,295.35 | 2,712.63 | 226.96 |
| 1992M06 | 3,289.59 | 2,706.70 | 225.29 |
| 1992M07 | 3,284.81 | 2,705.25 | 225.20 |
| 1992M08 | 3,284.99 | 2,694.07 | 223.45 |
| 1992M09 | 3,278.35 | 2,693.33 | 223.38 |
| 1992M10 | 3,278.13 | 2,694.29 | 222.92 |
| 1992M11 | 3,268.37 | 2,685.34 | 222.47 |
| 1992M12 | 3,270.75 | 2,687.88 | 221.98 |
| 1993M01 | 3,287.38 | 2,704.18 | 222.72 |
| 1993M02 | 3,291.70 | 2,706.96 | 222.36 |
| 1993M03 | 3,285.64 | 2,701.39 | 221.56 |
| 1993M04 | 3,292.23 | 2,709.99 | 221.10 |
| 1993M05 | 3,288.89 | 2,708.59 | 221.75 |
| 1993M06 | 3,291.90 | 2,708.64 | 220.78 |
| 1993M07 | 3,313.93 | 2,711.82 | 219.38 |
| 1993M08 | 3,307.34 | 2,713.97 | 217.94 |
| 1993M09 | 3,304.38 | 2,713.78 | 217.68 |
| 1993M10 | 3,309.47 | 2,723.92 | 216.98 |
| 1993M11 | 3,309.77 | 2,724.02 | 215.94 |
| 1993M12 | 3,315.71 | 2,727.99 | 214.95 |
| 1994M01 | 3,317.11 | 2,728.35 | 213.44 |
| 1994M02 | 3,319.13 | 2,730.24 | 212.51 |
| 1994M03 | 3,325.92 | 2,738.17 | 212.91 |
| 1994M04 | 3,330.89 | 2,745.12 | 213.50 |
| 1994M05 | 3,329.47 | 2,745.76 | 212.66 |
| 1994M06 | 3,331.25 | 2,752.77 | 212.16 |
| 1994M07 | 3,327.03 | 2,758.83 | 211.71 |
| 1994M08 | 3,332.64 | 2,764.66 | 212.40 |
| 1994M09 | 3,328.92 | 2,766.72 | 210.97 |
| 1994M10 | 3,343.36 | 2,765.45 | 210.81 |
| 1994M11 | 3,344.89 | 2,772.29 | 210.24 |
| 1994M12 | 3,345.22 | 2,776.02 | 210.17 |
| 1995M01 | 3,345.98 | 2,779.52 | 210.65 |
| 1995M02 | 3,345.98 | 2,781.76 | 210.80 |
| 1995M03 | 3,345.75 | 2,784.28 | 210.07 |
| 1995M04 | 3,344.34 | 2,782.55 | 209.44 |
| 1995M05 | 3,346.63 | 2,786.45 | 208.20 |
| 1995M06 | 3,348.74 | 2,787.62 | 207.81 |
| 1995M07 | 3,344.17 | 2,780.95 | 207.42 |
| 1995M08 | 3,350.58 | 2,788.54 | 207.66 |
| 1995M09 | 3,352.00 | 2,797.65 | 207.19 |
| 1995M10 | 3,350.87 | 2,797.55 | 205.73 |
| 1995M11 | 3,356.36 | 2,803.68 | 205.44 |
| 1995M12 | 3,355.13 | 2,803.70 | 205.06 |
| 1996M01 | 3,340.53 | 2,793.67 | 200.97 |
| 1996M02 | 3,365.34 | 2,817.66 | 201.86 |
| 1996M03 | 3,364.67 | 2,817.19 | 201.25 |
| 1996M04 | 3,366.19 | 2,818.99 | 198.36 |
| 1996M05 | 3,377.78 | 2,831.68 | 199.75 |
| 1996M06 | 3,384.12 | 2,836.45 | 200.21 |
| 1996M07 | 3,374.55 | 2,833.49 | 200.12 |
| 1996M08 | 3,381.87 | 2,840.35 | 201.03 |
| 1996M09 | 3,387.69 | 2,843.18 | 201.29 |
| 1996M10 | 3,400.29 | 2,856.48 | 201.12 |
| 1996M11 | 3,405.02 | 2,863.10 | 200.35 |
| 1996M12 | 3,408.26 | 2,864.00 | 200.40 |
| 1997M01 | 3,417.09 | 2,869.70 | 201.66 |
| 1997M02 | 3,415.55 | 2,870.44 | 200.67 |
| 1997M03 | 3,428.23 | 2,882.83 | 201.38 |
| 1997M04 | 3,428.25 | 2,883.10 | 201.80 |
| 1997M05 | 3,434.70 | 2,888.42 | 201.39 |
| 1997M06 | 3,442.05 | 2,895.64 | 200.44 |
| 1997M07 | 3,460.19 | 2,909.00 | 200.55 |
| 1997M08 | 3,462.67 | 2,909.27 | 200.40 |
| 1997M09 | 3,477.47 | 2,924.35 | 200.30 |
| 1997M10 | 3,486.54 | 2,926.69 | 201.83 |
| 1997M11 | 3,484.92 | 2,928.67 | 201.74 |
| 1997M12 | 3,498.32 | 2,941.87 | 202.38 |
| 1998M01 | 3,501.25 | 2,946.85 | 201.91 |
| 1998M02 | 3,505.23 | 2,946.40 | 201.02 |
| 1998M03 | 3,513.57 | 2,952.21 | 199.65 |
| 1998M04 | 3,519.00 | 2,959.92 | 197.98 |
| 1998M05 | 3,528.90 | 2,968.54 | 197.57 |
| 1998M06 | 3,532.57 | 2,973.14 | 196.47 |
| 1998M07 | 3,550.45 | 2,990.02 | 196.14 |
| 1998M08 | 3,556.45 | 2,993.38 | 194.53 |
| 1998M09 | 3,554.61 | 2,996.55 | 193.92 |
| 1998M10 | 3,570.45 | 3,007.58 | 191.61 |
| 1998M11 | 3,577.85 | 3,012.05 | 191.25 |
| 1998M12 | 3,583.96 | 3,016.80 | 189.66 |
| 1999M01 | 3,606.96 | 3,042.38 | 192.12 |
| 1999M02 | 3,609.74 | 3,044.15 | 189.48 |
| 1999M03 | 3,610.74 | 3,045.84 | 188.27 |
| 1999M04 | 3,612.87 | 3,047.97 | 188.04 |
| 1999M05 | 3,613.05 | 3,047.18 | 187.17 |
| 1999M06 | 3,619.21 | 3,053.03 | 186.43 |
| 1999M07 | 3,642.27 | 3,062.21 | 186.20 |
| 1999M08 | 3,649.66 | 3,069.70 | 185.17 |
| 1999M09 | 3,635.66 | 3,065.40 | 184.08 |
| 1999M10 | 3,662.52 | 3,092.64 | 185.86 |
| 1999M11 | 3,671.97 | 3,103.98 | 185.66 |
| 1999M12 | 3,681.07 | 3,112.63 | 184.18 |
| 2000M01 | 3,696.88 | 3,126.12 | 182.85 |
| 2000M02 | 3,699.27 | 3,129.95 | 181.82 |
| 2000M03 | 3,706.79 | 3,136.42 | 181.25 |
| 2000M04 | 3,727.91 | 3,151.51 | 180.43 |
| 2000M05 | 3,743.26 | 3,152.98 | 178.24 |
| 2000M06 | 3,739.60 | 3,164.66 | 177.80 |
| 2000M07 | 3,733.68 | 3,156.82 | 176.24 |
| 2000M08 | 3,723.97 | 3,156.59 | 175.17 |
| 2000M09 | 3,754.74 | 3,185.37 | 174.13 |
| 2000M10 | 3,765.74 | 3,192.94 | 172.99 |
| 2000M11 | 3,766.76 | 3,199.31 | 171.27 |
| 2000M12 | 3,768.46 | 3,201.02 | 170.67 |
| 2001M01 | 3,773.88 | 3,207.40 | 165.52 |
| 2001M02 | 3,763.83 | 3,202.95 | 164.04 |
| 2001M03 | 3,761.46 | 3,198.76 | 162.41 |
| 2001M04 | 3,742.36 | 3,174.22 | 159.88 |
| 2001M05 | 3,737.91 | 3,176.68 | 158.33 |
| 2001M06 | 3,728.70 | 3,168.59 | 157.53 |
| 2001M07 | 3,732.25 | 3,150.72 | 155.13 |
| 2001M08 | 3,725.61 | 3,143.32 | 153.71 |
| 2001M09 | 3,696.00 | 3,127.95 | 151.07 |
| 2001M10 | 3,625.88 | 3,058.37 | 148.13 |
| 2001M11 | 3,624.04 | 3,055.07 | 146.65 |
| 2001M12 | 3,612.91 | 3,045.65 | 145.44 |
| 2002M01 | 3,609.20 | 3,036.02 | 143.79 |
| 2002M02 | 3,612.74 | 3,040.05 | 143.01 |
| 2002M03 | 3,609.39 | 3,035.35 | 142.14 |
| 2002M04 | 3,605.80 | 3,035.77 | 141.70 |
| 2002M05 | 3,613.36 | 3,040.61 | 141.83 |
| 2002M06 | 3,606.72 | 3,033.67 | 140.27 |
| 2002M07 | 3,600.91 | 3,027.27 | 139.63 |
| 2002M08 | 3,601.56 | 3,025.87 | 139.14 |
| 2002M09 | 3,595.49 | 3,021.18 | 137.60 |
| 2002M10 | 3,600.41 | 3,028.06 | 136.66 |
| 2002M11 | 3,600.12 | 3,024.86 | 134.87 |
| 2002M12 | 3,594.06 | 3,018.22 | 133.42 |
| 2003M01 | 3,580.91 | 3,011.13 | 132.75 |
| 2003M02 | 3,574.83 | 3,004.78 | 131.74 |
| 2003M03 | 3,563.90 | 2,996.58 | 130.76 |
| 2003M04 | 3,555.55 | 2,989.46 | 129.01 |
| 2003M05 | 3,554.06 | 2,988.22 | 127.59 |
| 2003M06 | 3,547.64 | 2,981.97 | 126.00 |
| 2003M07 | 3,540.96 | 2,980.69 | 124.79 |
| 2003M08 | 3,538.03 | 2,976.63 | 123.96 |
| 2003M09 | 3,548.01 | 2,984.65 | 123.57 |
| 2003M10 | 3,555.84 | 2,990.30 | 123.27 |
| 2003M11 | 3,556.92 | 2,990.50 | 123.39 |
| 2003M12 | 3,555.94 | 2,989.11 | 123.04 |
| 2004M01 | 3,549.56 | 2,983.67 | 123.20 |
| 2004M02 | 3,555.44 | 2,989.18 | 122.95 |
| 2004M03 | 3,563.91 | 2,997.91 | 122.77 |
| 2004M04 | 3,564.03 | 2,998.28 | 121.48 |
| 2004M05 | 3,570.70 | 3,004.46 | 121.30 |
| 2004M06 | 3,574.98 | 3,007.98 | 121.17 |
| 2004M07 | 3,587.17 | 3,022.11 | 120.96 |
| 2004M08 | 3,585.98 | 3,021.65 | 120.46 |
| 2004M09 | 3,585.57 | 3,021.60 | 119.86 |
| 2004M10 | 3,591.08 | 3,025.27 | 119.08 |
| 2004M11 | 3,590.75 | 3,025.51 | 118.81 |
| 2004M12 | 3,593.91 | 3,033.27 | 118.36 |
| 2005M01 | 3,604.44 | 3,038.32 | 117.61 |
| 2005M02 | 3,604.56 | 3,039.05 | 116.84 |
| 2005M03 | 3,606.08 | 3,041.12 | 116.27 |
| 2005M04 | 3,625.35 | 3,057.11 | 115.51 |
| 2005M05 | 3,621.34 | 3,052.89 | 114.03 |
| 2005M06 | 3,627.85 | 3,057.31 | 113.87 |
| 2005M07 | 3,633.33 | 3,062.97 | 113.56 |
| 2005M08 | 3,643.09 | 3,073.03 | 113.45 |
| 2005M09 | 3,654.19 | 3,083.42 | 112.56 |
| 2005M10 | 3,640.54 | 3,074.27 | 111.66 |
| 2005M11 | 3,652.35 | 3,084.08 | 111.03 |
| 2005M12 | 3,662.08 | 3,093.89 | 110.89 |
| 2006M01 | 3,662.84 | 3,093.00 | 109.32 |
| 2006M02 | 3,666.11 | 3,098.01 | 108.45 |
| 2006M03 | 3,678.37 | 3,109.66 | 107.65 |
| 2006M04 | 3,681.79 | 3,113.19 | 107.46 |
| 2006M05 | 3,691.80 | 3,122.57 | 107.18 |
| 2006M06 | 3,698.60 | 3,130.53 | 107.13 |
| 2006M07 | 3,694.75 | 3,127.34 | 105.17 |
| 2006M08 | 3,697.70 | 3,131.19 | 104.89 |
| 2006M09 | 3,712.61 | 3,141.85 | 104.47 |
| 2006M10 | 3,716.81 | 3,146.57 | 104.20 |
| 2006M11 | 3,729.08 | 3,156.81 | 103.77 |
| 2006M12 | 3,741.02 | 3,167.53 | 103.37 |
| 2007M01 | 3,749.76 | 3,175.77 | 104.16 |
| 2007M02 | 3,757.74 | 3,182.40 | 103.70 |
| 2007M03 | 3,763.00 | 3,188.31 | 102.91 |
| 2007M04 | 3,758.53 | 3,186.30 | 102.38 |
| 2007M05 | 3,767.23 | 3,194.42 | 101.94 |
| 2007M06 | 3,776.89 | 3,204.52 | 101.16 |
| 2007M07 | 3,776.26 | 3,203.67 | 100.80 |
| 2007M08 | 3,777.42 | 3,202.88 | 99.83 |
| 2007M09 | 3,781.26 | 3,205.09 | 99.42 |
| 2007M10 | 3,799.26 | 3,222.88 | 98.88 |
| 2007M11 | 3,807.53 | 3,228.94 | 98.64 |
| 2007M12 | 3,810.67 | 3,231.38 | 98.57 |
| 2008M01 | 3,825.69 | 3,244.91 | 98.68 |
| 2008M02 | 3,832.92 | 3,252.24 | 98.39 |
| 2008M03 | 3,831.90 | 3,250.87 | 97.90 |
| 2008M04 | 3,837.68 | 3,255.97 | 97.37 |
| 2008M05 | 3,832.46 | 3,252.23 | 96.39 |
| 2008M06 | 3,835.34 | 3,254.91 | 96.12 |
| 2008M07 | 3,837.80 | 3,257.38 | 95.80 |
| 2008M08 | 3,841.73 | 3,259.21 | 95.20 |
| 2008M09 | 3,835.14 | 3,254.28 | 94.62 |
| 2008M10 | 3,824.85 | 3,243.53 | 93.48 |
| 2008M11 | 3,815.68 | 3,231.23 | 92.22 |
| 2008M12 | 3,806.08 | 3,220.78 | 91.03 |
| 2009M01 | 3,786.58 | 3,200.36 | 88.30 |
| 2009M02 | 3,769.50 | 3,185.41 | 86.35 |
| 2009M03 | 3,749.26 | 3,165.56 | 84.98 |
| 2009M04 | 3,725.08 | 3,142.60 | 82.82 |
| 2009M05 | 3,722.97 | 3,143.35 | 82.25 |
| 2009M06 | 3,714.38 | 3,136.00 | 81.67 |
| 2009M07 | 3,739.24 | 3,128.78 | 80.80 |
| 2009M08 | 3,734.64 | 3,120.55 | 79.77 |
| 2009M09 | 3,703.92 | 3,128.47 | 79.31 |
| 2009M10 | 3,706.63 | 3,128.60 | 78.57 |
| 2009M11 | 3,707.28 | 3,127.12 | 77.79 |
| 2009M12 | 3,713.64 | 3,133.24 | 77.49 |
| 2010M01 | 3,717.57 | 3,136.82 | 77.11 |
| 2010M02 | 3,720.54 | 3,139.69 | 76.99 |
| 2010M03 | 3,730.08 | 3,149.36 | 77.06 |
| 2010M04 | 3,746.60 | 3,162.85 | 76.98 |
| 2010M05 | 3,766.43 | 3,163.80 | 76.54 |
| 2010M06 | 3,759.97 | 3,167.36 | 76.42 |
| 2010M07 | 3,742.91 | 3,173.70 | 76.48 |
| 2010M08 | 3,750.28 | 3,181.28 | 75.93 |
| 2010M09 | 3,756.02 | 3,182.51 | 75.47 |
| 2010M10 | 3,769.32 | 3,196.58 | 75.72 |
| 2010M11 | 3,774.58 | 3,204.10 | 75.77 |
| 2010M12 | 3,780.33 | 3,210.37 | 75.74 |
| 2011M01 | 3,795.60 | 3,223.99 | 75.71 |
| 2011M02 | 3,805.41 | 3,234.48 | 75.57 |
| 2011M03 | 3,811.32 | 3,241.78 | 75.40 |
| 2011M04 | 3,830.67 | 3,259.14 | 75.39 |
| 2011M05 | 3,830.77 | 3,260.80 | 75.17 |
| 2011M06 | 3,833.29 | 3,263.36 | 75.33 |
| 2011M07 | 3,849.28 | 3,273.51 | 75.51 |
| 2011M08 | 3,860.77 | 3,273.68 | 75.73 |
| 2011M09 | 3,865.66 | 3,293.25 | 75.96 |
| 2011M10 | 3,860.00 | 3,286.71 | 75.88 |
| 2011M11 | 3,869.94 | 3,295.84 | 76.25 |
| 2011M12 | 3,873.57 | 3,301.49 | 76.36 |
| 2012M01 | 3,886.81 | 3,317.43 | 76.65 |
| 2012M02 | 3,898.71 | 3,327.73 | 76.70 |
| 2012M03 | 3,910.31 | 3,338.84 | 76.52 |
| 2012M04 | 3,909.14 | 3,339.37 | 76.39 |
| 2012M05 | 3,928.48 | 3,358.52 | 76.51 |
| 2012M06 | 3,931.51 | 3,362.28 | 76.66 |
| 2012M07 | 3,920.16 | 3,353.25 | 76.64 |
| 2012M08 | 3,938.30 | 3,368.42 | 76.23 |
| 2012M09 | 3,953.60 | 3,381.98 | 76.77 |
| 2012M10 | 3,957.29 | 3,384.80 | 76.35 |
| 2012M11 | 3,942.36 | 3,370.34 | 75.28 |
| 2012M12 | 3,965.86 | 3,394.60 | 75.76 |
| 2013M01 | 3,971.39 | 3,400.60 | 75.76 |
| 2013M02 | 3,974.10 | 3,403.36 | 75.83 |
| 2013M03 | 3,987.71 | 3,417.98 | 75.65 |
| 2013M04 | 4,004.10 | 3,434.97 | 76.76 |
| 2013M05 | 4,007.57 | 3,437.81 | 76.64 |
| 2013M06 | 4,013.82 | 3,444.11 | 76.21 |
| 2013M07 | 4,029.81 | 3,459.36 | 76.14 |
| 2013M08 | 4,035.76 | 3,464.80 | 76.47 |
| 2013M09 | 4,044.25 | 3,474.34 | 76.59 |
| 2013M10 | 4,063.74 | 3,492.59 | 76.76 |
| 2013M11 | 4,077.89 | 3,506.34 | 76.79 |
| 2013M12 | 4,084.02 | 3,512.72 | 77.00 |
| 2014M01 | 4,087.53 | 3,517.39 | 76.31 |
| 2014M02 | 4,100.39 | 3,529.77 | 76.57 |
| 2014M03 | 4,110.46 | 3,540.24 | 76.28 |
| 2014M04 | 4,124.45 | 3,552.68 | 76.20 |
| 2014M05 | 4,140.60 | 3,569.00 | 76.46 |
| 2014M06 | 4,151.62 | 3,579.42 | 76.54 |
| 2014M07 | 4,164.42 | 3,591.68 | 76.47 |
| 2014M08 | 4,182.51 | 3,608.23 | 76.71 |
| 2014M09 | 4,187.44 | 3,612.44 | 76.82 |
| 2014M10 | 4,201.29 | 3,625.48 | 76.90 |
| 2014M11 | 4,213.96 | 3,637.05 | 77.20 |
| 2014M12 | 4,224.03 | 3,647.24 | 77.26 |
| 2015M01 | 4,233.57 | 3,656.72 | 77.49 |
| 2015M02 | 4,240.28 | 3,663.39 | 77.57 |
| 2015M03 | 4,247.12 | 3,670.36 | 77.64 |
| 2015M04 | 4,257.05 | 3,678.81 | 77.85 |
| 2015M05 | 4,269.42 | 3,691.28 | 77.78 |
| 2015M06 | 4,279.30 | 3,700.27 | 77.92 |
| 2015M07 | 4,294.94 | 3,715.21 | 78.13 |
| 2015M08 | 4,300.52 | 3,719.49 | 78.07 |
| 2015M09 | 4,302.44 | 3,721.77 | 78.11 |
| 2015M10 | 4,325.04 | 3,744.35 | 78.24 |
| 2015M11 | 4,332.29 | 3,749.91 | 78.03 |
| 2015M12 | 4,339.62 | 3,756.97 | 77.90 |
| 2016M01 | 4,343.37 | 3,761.55 | 77.64 |
| 2016M02 | 4,347.76 | 3,765.24 | 77.66 |
| 2016M03 | 4,357.85 | 3,774.68 | 77.17 |
| 2016M04 | 4,370.22 | 3,787.43 | 76.82 |
| 2016M05 | 4,355.66 | 3,772.95 | 76.41 |
| 2016M06 | 4,369.52 | 3,785.94 | 76.08 |
| 2016M07 | 4,383.34 | 3,799.48 | 76.12 |
| 2016M08 | 4,392.60 | 3,806.10 | 75.80 |
| 2016M09 | 4,400.09 | 3,815.81 | 75.40 |
| 2016M10 | 4,393.39 | 3,809.26 | 75.28 |
| 2016M11 | 4,401.41 | 3,817.42 | 74.90 |
| 2016M12 | 4,411.30 | 3,826.65 | 74.72 |
| 2017M01 | 4,424.54 | 3,838.44 | 74.52 |
| 2017M02 | 4,436.38 | 3,850.69 | 74.27 |
| 2017M03 | 4,438.31 | 3,852.90 | 74.11 |
| 2017M04 | 4,433.76 | 3,848.52 | 73.90 |
| 2017M05 | 4,452.88 | 3,868.46 | 73.70 |
| 2017M06 | 4,466.82 | 3,881.48 | 73.43 |
| 2017M07 | 4,467.03 | 3,881.46 | 73.07 |
| 2017M08 | 4,473.41 | 3,890.96 | 72.63 |
| 2017M09 | 4,487.33 | 3,903.15 | 72.63 |
| 2017M10 | 4,488.86 | 3,904.02 | 72.20 |
| 2017M11 | 4,498.71 | 3,915.51 | 72.27 |
| 2017M12 | 4,508.11 | 3,924.14 | 72.03 |
| 2018M01 | 4,504.33 | 3,919.85 | 71.90 |
| 2018M02 | 4,524.64 | 3,940.39 | 71.74 |
| 2018M03 | 4,534.11 | 3,949.37 | 71.38 |
| 2018M04 | 4,529.61 | 3,944.94 | 70.98 |
| 2018M05 | 4,540.61 | 3,955.54 | 70.69 |
| 2018M06 | 4,564.68 | 3,972.53 | 70.60 |
| 2018M07 | 4,545.12 | 3,975.04 | 70.20 |
| 2018M08 | 4,555.30 | 3,980.06 | 70.03 |
| 2018M09 | 4,576.36 | 3,983.82 | 69.46 |
| 2018M10 | 4,588.47 | 4,002.80 | 69.06 |
| 2018M11 | 4,602.53 | 4,012.10 | 68.83 |
| 2018M12 | 4,602.99 | 4,016.12 | 68.85 |
| 2019M01 | 4,614.72 | 4,030.68 | 68.49 |
| 2019M02 | 4,625.43 | 4,041.12 | 68.12 |
| 2019M03 | 4,636.65 | 4,052.45 | 67.97 |
| 2019M04 | 4,647.14 | 4,063.83 | 67.87 |
| 2019M05 | 4,650.19 | 4,065.45 | 67.59 |
| 2019M06 | 4,664.62 | 4,070.54 | 67.40 |
| 2019M07 | 4,641.01 | 4,071.34 | 66.92 |
| 2019M08 | 4,656.89 | 4,076.02 | 66.55 |
| 2019M09 | 4,680.20 | 4,084.40 | 66.46 |
| 2019M10 | 4,676.36 | 4,078.42 | 66.18 |
| 2019M11 | 4,687.42 | 4,086.86 | 66.61 |
| 2019M12 | 4,685.04 | 4,088.10 | 67.14 |
| 2020M01 | 4,653.31 | 4,059.93 | 65.77 |
| 2020M02 | 4,683.34 | 4,090.66 | 66.87 |
| 2020M03 | 4,612.61 | 4,018.07 | 67.40 |
| 2020M04 | 3,773.29 | 3,197.04 | 47.86 |
| 2020M05 | 3,786.33 | 3,217.23 | 50.85 |
| 2020M06 | 3,893.70 | 3,322.50 | 54.04 |
| 2020M07 | 3,909.82 | 3,408.18 | 54.57 |
| 2020M08 | 4,022.90 | 3,469.60 | 54.13 |
| 2020M09 | 4,057.19 | 3,496.24 | 54.17 |


