

Office of the Comptroller
Stringer has proposed big policy changes on housing and child care, two major expenses squeezing some New Yorkers’ incomes.
For too many New Yorkers, the city’s affordability crisis has tragic and easily measurable manifestations. There are data about how many people get evicted each year. Statistics are available on the number of people living in homeless shelters. We hear the count of homeless children attending schools.
Most New Yorkers do not directly experience effects of that magnitude. Yet many of us say we feel the squeeze, too.
How much of that is reality, and how much is perception? Life in the big city has always been expensive, no? And aren’t some of those soaring rents being paid by people with swelling incomes?
A new digital “affordability index” released Wednesday by City Comptroller Scott Stringer takes a broad look at income and expenses in the city and finds that for large sections of the population, the lack of affordability is very real, and is about more than housing.
In fact, the full impact of the tension between slow-growing incomes and swelling costs for essentials is most visible when you look at what—if anything—is left over after the bills for life’s necessities are taken care of.
“New York City’s affordability crisis impacts every New Yorker and every community – and the numbers laid out in our affordability index shine a light on this worsening crisis. Over the last decade, the lack of affordable housing and the soaring cost of everything from child care to basic everyday necessities, have ravaged New Yorkers’ bank accounts, and now, these pressures are pushing people out,” Stringer said in a statement.
Stringer’s tool looks at “typical” middle-income households (those with incomes at the average of households between the 40th and 60 percentile) within four large subgroups in the city: single adults, single parents with two kids, married couples without children in the household, and married couples with two kids. Since eligibility and participation in government benefit programs is far from universal, the comptroller’s tool doesn’t account for how Section 8 vouchers, SNAP food subsidies or subsidized health insurance might enhance some families’ income.
The comptroller’s researchers then gathered data on expenses in a few broad categories: housing and utilities, taxes, food, child care, transportation, healthcare and “other necessities” like clothes, toiletries and household products.
Then they compared the income to those expenses to see what, if anything, was left over, each year from 2005 through 2017—because, as their report points out, “The ability to provide for the future of oneself and one’s family and to enjoy a decent quality of life depends on what remains after meeting the basics.” (That “extra” income also represents potential consumer spending for other sectors of the city economy, like entertainment, fitness and education.)
Office of the Comptroller
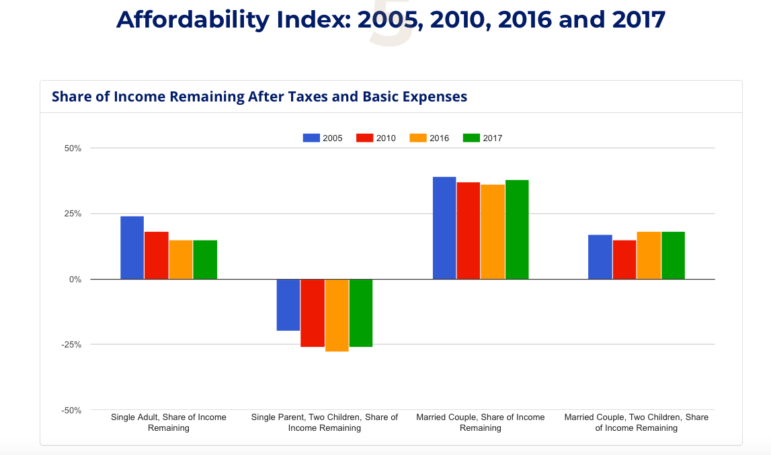
A slide from the comptroller’s report.
The results are telling. In 2005, the average middle-income single adult cleared 24 percent of her income after expenses. In 2017, it was only 15 percent. That was the biggest drop over the period the researchers examined.
But the harshest climate was the one faced by single parents. At no time did the average middle-income single-parent household live in the black. Instead, they faced an income deficit that grew from 20 percent in 2006 to 40 percent in 2012 before settling at 26 percent in 2017. Presumably, public benefits at least partially filled the gap for some of the real families that those statistics aggregate. Either that, or people went without essentials. Either way, it’s pretty dire math.
Married families with two kids saw their share of “excess income” stay essentially flat: 17 percent in 2005 and 18 percent in 2017. And married families without kids fared most comfortably. In 2005, the average middle-income couple cleared 39 percent of income after essentials; it was 38 percent in 2017.
The measures involve an element of abstraction: No family actually faced average expenses in every category and saw its income track the average of its demographic group in each of the 13 years examined. But with some reasonable generalization, the takeaways are clear:
• Some families (namely, single parents) cannot live in the city without ample government intervention or skipping basic needs (or both) and their fundamental economic situation has not improved much in recent years.
• Single adults—which could mean college kids just starting out or elderly widows or anyone in between – face increasingly tight margins.
• Married couples generally do a lot better (you don’t need a Nobel Prize to realize two incomes are better than one) but people with children have a lot less wiggle room than people without.
What does all that data recommend for policy? Both sides of the equation offer opportunities. Boosting incomes would obviously help, but so would controlling healthcare costs. Food prices have been relatively stable, and taxes generally hit households in a progressive manner. After soaring in the early part of the study period, childcare costs have leveled off, but Stringer (who has recently presented proposals for new child-care policy) argues they still present an opportunity for targeted action.
And then there’s housing.
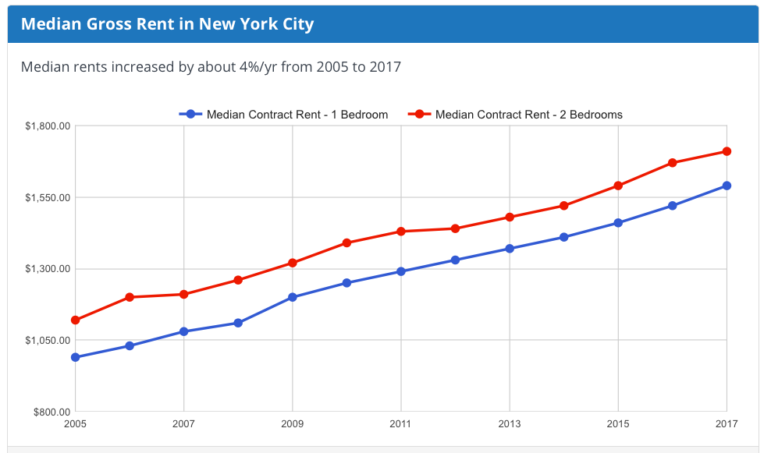
Office of the Comptroller
Some costs rise and fall. Housing prices grow steadily.
Rents, as the above chart illustrates, climb ever upward. But their impact varies by household type: Housing eats up 37 percent of the average single adult’s income, which is too high, and 47 percent of the average single parent’s, which is crisis-level. Yet average housing costs only represent 17 percent of the income of the average married couple without kids and 20 percent for the average married couple with children. That suggests, as many have argued for a long time, that the most dramatic need for affordable housing is for people with moderate and low incomes, not those who make into the six figures.
“This data shows exactly why we need an affordable housing plan that puts people before profits and a bold investment in quality affordable child care,” Stringer, who has called for big changes to the way the city approaches affordable-housing production, said. “We can’t allow a two-million dollar luxury condo to become the entry price to New York City. We need to meet this growing crisis with the urgency it demands and do everything in our power to keep New York City an aspirational city for our next generation.”
His office says it plans to update the tool annually.


One thought on “Report: What NYers Have Left After Housing Costs, Other Essentials”
And when it comes to housing costs, NYers are generally pretty lucky because they only have to cover rent and utilities. The only other expenses that people usually have to cover are food and transportation, but as long as you’re willing to take public transit or bike to work, those shouldn’t be very expensive.