Photo by: Taleen Dersdepanian
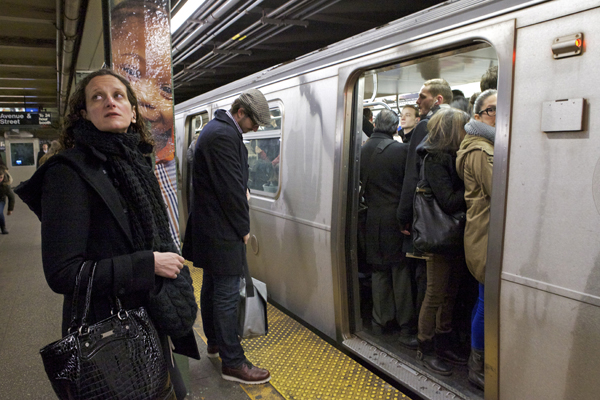
Commuters wait as the L-train arrives at the Bedford stop. A Brooklynite is 20 times more likely than the average American to take mass transit to get to work.
It’s always been moving to see Brooklynites move. In a poem called “Crossing Brooklyn Ferry,” Walt Whitman could barely contain himself: “Crowds of men and women attired in the usual costumes! how curious you are to me! On the ferry-boats, the hundreds and hundreds that cross, returning home, are more curious to me than you suppose.”
Straphangers shoe-horning themselves onto a packed L train or waiting endlessly for the B41 bus might sometimes find Brooklyn’s commuting crowds more contemptible than curious. But a new report from Brooklyn College’s Center for the Study of Brooklyn, finds that despite rising fares and crowded platforms, more Brooklynites are using mass transit—even in outlying areas where taking the train takes a lot of time.
The percentage of Brooklynites who use mass transit increased from 56 percent in the 2000 Census to 60 percent in the 2007-2009 American Community Survey, also put out by the Census Bureau. The share that drove slipped from 32 percent to 26 percent.
Brooklyn uses the MTA slightly more than people citywide—55 percent use mass transit to get to work—and drives slightly less than the whole city, where 30 percent take their cars to work.
But compared to the rest of the state and the country, the reliance on mass transit is stunning. Only 27 percent of Empire State residents take public transportation to their jobs; some 62 percent drive. Nationally, a mere 5 percent of commuters use mass transit, while 87 percent take their cars to work.
A look inside the trends
Those facts and hundreds of others are documented in a set of Neighborhood Reports the Center for the Study of Brooklyn released on Thursday. The 19 reports cover Brooklyn at-large and its 18 community boards, examining demographics, jobs, poverty, crime, health, the environment, housing and more.
As City Limits detailed last year, few urban areas in America have the kind of cachet Brooklyn boasts, and in the past decade New York’s largest borough has only become more of a destination. But the broad-brush picture of Brooklyn as the epicenter of cool masks important details.
“Many of the basic indicators for the borough as a whole show that we’re doing relatively well compared with ten and twenty years ago,” Gretchen Maneval, director of the Center for the Study of Brooklyn, told City Limits. “However, as a subtext to this prosperity, immense disparities emerge when we look at data on the neighborhood level,” she added. “In other words, while we celebrate and build upon our recent successes, there is still change to be made.”
The Center was launched in 2005 with funding from the organization now known as the Brooklyn Community Foundation (which also helps fund the Brooklyn Bureau). It began in mid-2009 to conduct extensive research on social indicators in Brooklyn.
The statistical reports released Thursday are a prelude to a comprehensive narrative report looking at key issues in the borough, called the Brooklyn Trends Report, that is due out later this year. The Center plans for public forums to discuss the findings of both reports.
Change, progress, concerns
Some of the findings in the Neighborhood Reports include:
- Demographics: Brooklyn’s population is less Asian and Latino and more black than the city as a whole. Asians, for instance, make up 9.4 percent of the borough and 11.8 percent of the city. Latinos are under 20 percent of Brooklyn and more than 27 percent citywide. Less than a quarter of New York City is black but roughly a third of Brooklyn is. But while Asians are a small presence in Brooklyn, their footprint is growing fastest, increasing by nearly two percentage points from 2000 to 2009.
- Language: Language reflects the demographic change. English and Spanish are still spoken in most households, but their combined share has slipped from 78 percent in 1990 to 71 percent in 2007/2009. In 1990, more Brooklynites spoke Italian and Yiddish at home than Chinese. Now, Chinese, Russian and Yiddish round out the top 5 tongues.
- Poverty: Poverty decreased borough-wide from 2000 to 2009, but was still higher than outside Brooklyn: 21.2 percent of Brooklynites were living in poverty in the most recent set of data, compared to 18.3 percent citywide and 13.7 percent across New York State.
- Housing: Forty-four percent of Brooklyn homeowners spend more than 30 percent of their income on housing and 24 percent devoted half their income to paying a mortgage. But if the picture on the ownership side is distressing, it is downright grim for renters: 52 percent of renters in Brooklyn spend more than the recommended 30 percent of their income on rent and nearly 29 percent spend more than half their money on housing.
- Education: 2010-2011 graduation and college-readiness rates in Brooklyn lagged behind the citywide averages, but Brooklyn is generally better educated now than in 2000, with the share of people without a diploma or GED shrinking from 31 percent to 22 percent and the number with at least a bachelor’s degree shooting from 22 percent to 29 percent.
Other juicy stats abound: Asthma rates have slipped slightly, but so has recycling. Most Brooklynites say they’re in “good” or “very good” health, but more believe their health is “fair or poor” than “excellent.” Violent crime is down, but the cost of incarcerating the Brooklyn adults who went to prison in 2009 will be more than $300 million over the course of their sentences. Spending per capita on culture in Brooklyn is around half what Manhattan boasts. More of Brooklyn is registered to vote than in the city at large, but less actually did so in the 2008 presidential election.
Data with limits and potential
Statistics, of course, reflect a moment in time and the phrasing of a question. The Brooklyn report reports a decrease (from 15 percent in 2000 to 13 percent in 2007/2009)in the number of “disconnected youth”—people aged 16 to 24 who are neither in school nor working—that runs counter to what one would expect given that unemployment rates for that group hit 19 percent nationally in 2009.
“Data about a particular topic should not be viewed as the definitive truth when being used to inform policy, funding or programming decisions,” Maneval warns. “It’s imperative that in addition to considering the data, we also hear from those who live and work in a community about their experiences, and their perspectives.”
Meanwhile, the differences between overall Brooklyn trends and reality in particular neighborhoods can be striking.
In Community Board 1, which covers Greenpoint and Williamsburg, median income rose 27 percent from 2000 to 2007/2009. About five miles away, in Community Board 5, encompassing City Line and East New York, income rose a mere 3 percent. The foreclosure rate in CB1 was 9.4 per 1,000 properties; in CB5, it was 56.4 percent. There was twice as much violent crime, and there were twice as many stop-and-frisk encounters in CB5. The high-school graduation rate was 38 percent higher in CB1.
Yet, for all their differences, both districts had a poverty rate of about 28 percent – substantially above the borough average.
For Marilyn Gelber, the president of the Brooklyn Community Foundation, getting data that paints such a complex picture fulfills the hope that accompanied the creation of community boards in the mid-1970s. At the time, Gelber was a young city planner.
“Our goal was to bring government closer to the community and provide residents with useful data about what local government was doing, and what it was spending in their neighborhoods,” Gelber says. “In some ways, this project represents to me coming back full circle to reflect on change in Brooklyn—looking on a community by community basis, seeing what’s changed and what hasn’t, the waves of new residents, the lasting loyalty of Brooklyn lifers, and the excitement of imagining what the future might be.”
Brooklyn underground (and on the bus)
In Community Board 5, it can take an hour and 15 minutes to ride mass transit to Manhattan, and only 30 minutes driving. Still, the share of residents there taking mass transit to work rose from 54 percent in 2000 to 63 percent in 2009, while drivers slipped from 38 percent to 29 percent of the population.
Of course, not all Brooklyn residents work on the west side of the East River. If going to Manhattan, “I would take the train because I would much rather be stuck in the train then stuck in traffic,” says area resident Joseph Saez, 24, “but for the most part I stay Brooklyn-bound, I only head to Manhattan when I go see my girlfriend.”
The ride into central Manhattan is only slightly shorter in parts of Community Board 15, which covers neighborhoods like Sheepshead Bay. Yet there, too, transit use edged up.
The same is true in Community Board 10, which encompasses Bay Ridge. There, 17-year-old freelance musician Corey Harkins says mass transit offers both aesthetic and practical advantages. “I like taking the train because you are out in the open, experiencing the city more. Plus you always meet new people and a chance of interacting with them,” he says. What’s more, “there are bus stop and trains almost everywhere.”
Even in Community Board 18, which covers a swath of coastal Brooklyn from Canarsie to Marine Park and is the rare area where more people drive than ride mass transit, public transit use grew and driving shrank over the past decade.
That’s not always by choice: People who can’t afford cars might drive if they could. “My neighborhood is really isolated from the subway system,” says Mike O’Brien, 27, who works at Bloomingdale’s. “You have to take a bus to the train and there is no rhyme or reason to the bus schedule so when I had my car I would drive to a nearby train stop and leave it there.”
But having a car wouldn’t change some commuters’ approach. Jamie Christian, 23, a substitute teacher, was asked if he’d ever consider driving to work. “No, because driving in the city sucks,” he said, “especially finding parking. It’s impossible.”