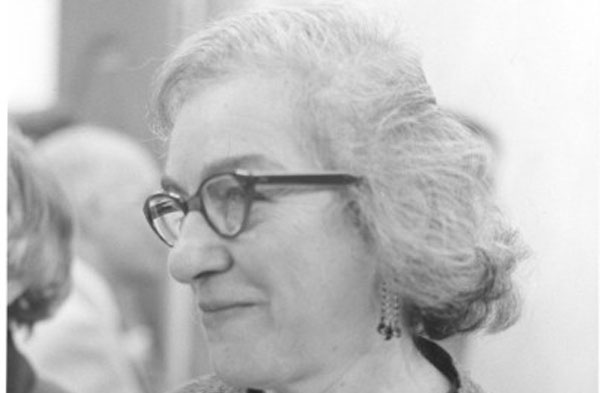
Photo by: SSA
USDA statistician Mollie Orshansky created the federal poverty line in 1963. For decades, critics have cited its flaws, but a raft of federal programs still rely on it.
If you’ve been trying to follow the debate over the new measure of poverty released by the Census Bureau this morning, you’re probably completely confused by now. So far in the last few days we’ve seen:
So now that the Supplemental Poverty Measure is out, what does it say? That poverty is 0.8 percent higher than under the old rule—16.0 percent vs. 15.2 percent in 2010—but that it’s indeed rising at a slower rate. But even that, it turns out, is hardly the good news that the Times portrayed it as.
Some brief background: The poverty line dates back to 1963, the year that USDA statistician Mollie Orshansky first concocted the measure by noting that the average American household spent one-third of its income on food, and therefore calculated that anyone making less than triple the cost of a sample subsistence “food basket” of grocery items would be defined as poor.
The poverty line’s many critics soon noted that Olshansky’s formula was growing obsolete: As food costs dropped while housing and other costs rose, earning enough to afford triple your grocery budget was no longer sufficient to survive, meaning that many families defined as above poverty level were still barely subsisting. At the same time, the expansion of welfare, food stamps and other government aid programs—none of which were counted in Orshansky’s measure—meant that people were being included as poor even if their total income counting government benefits was enough to get by on.
Getting the federal government to scrap the old poverty line, though, has been a stickier problem: Because eligibility for so many government aid programs depends on the line, any shift in states’ number of poor people could affect billions of dollars in government spending.
Largely for this reason, what Census did today was to introduce a “supplemental” measure that will coexist alongside the old Orshansky formula. The upshot: Even newly counting food stamps, the earned income tax credit, and other benefits as income, the effects of rising housing, health care, and child care costs mean that an extra 2.5 million people nationwide were poor in 2010. (A similar measure developed by former Community Service Society poverty expert Mark Levitan for Mayor Bloomberg in 2008 found several hundred thousand more New Yorkers living in poverty than under the traditional definition.)
So where did the Times get its cheery headline? While the revised poverty measures show modestly higher poverty in 2010, they indicate that poverty was much higher than reported back in 2006—and if things were that bad then, they didn’t have as far to rise. Voila: Half the increase in poverty over the last five years “disappears.”
This isn’t an indicator that things are better now, however, so much as that things were much worse during the last decade than anyone knew. “I think it’s more about the housing bubble,” Fremstad tells City Limits. Housing costs, he notes, peaked in 2007—and because housing expenditures are the biggest part of the new poverty threshold, that means that people were far poorer in real terms five years ago, when it was nearly impossible to find an affordable apartment.
Fremstad similar throws a bit of cold water on the Census report’s other headline-grabbing item, which is that child poverty is much lower than under the old poverty line, from 21.2 percent of all children to 17.3 percent, while poverty among the elderly is more severe. (Families with children are more likely to receive benefits like food stamps, which aren’t counted as income under the old poverty line.) Yet, he notes, the USDA’s measure of “food insecure” Americans found that 20.2 percent of families with children under 18 weren’t able to consistently afford enough food throughout the year, which is hardly reassuring.
Moreover, while the new measure counts medical expenses, it only includes out-of-pocket costs. “What that leaves out is if you’re a single mom without insurance and you can’t afford to take your kid to a doctor,” says Fremstad. “You’ve got an unmet medical need, but that’s not reflected in this measure.”
A fairer Times headline, then, might have read: “Americans Are Getting Poorer, But At Least Now Their Kids Can Get Food Stamps and Rents Have Come Down.” Unless, that is, you live in Manhattan or Brooklyn.